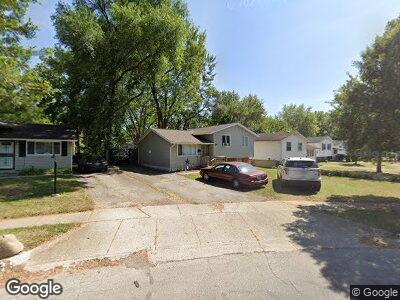
1804 Penfield Rd E Columbus, OH 43227
Linwood NeighborhoodEstimated Value: $128,000 - $243,000
3
Beds
1
Bath
924
Sq Ft
$199/Sq Ft
Est. Value
About This Home
This home is located at 1804 Penfield Rd E, Columbus, OH 43227 and is currently estimated at $184,284, approximately $199 per square foot. 1804 Penfield Rd E is a home located in Franklin County with nearby schools including Scottwood Elementary School, Johnson Park Middle School, and Walnut Ridge High School.
Ownership History
Date
Name
Owned For
Owner Type
Purchase Details
Closed on
Feb 25, 1999
Sold by
Ten Rose Investments Inc
Bought by
Hale Elizabeth D
Current Estimated Value
Home Financials for this Owner
Home Financials are based on the most recent Mortgage that was taken out on this home.
Original Mortgage
$68,850
Interest Rate
6.92%
Purchase Details
Closed on
Feb 1, 1999
Sold by
Woods Sylvia and Bank One Na
Bought by
Ten Rose Investments Ltd
Home Financials for this Owner
Home Financials are based on the most recent Mortgage that was taken out on this home.
Original Mortgage
$68,850
Interest Rate
6.92%
Purchase Details
Closed on
Jun 12, 1996
Sold by
John R Mion Trustee
Bought by
Sylvia Woods
Home Financials for this Owner
Home Financials are based on the most recent Mortgage that was taken out on this home.
Original Mortgage
$70,200
Interest Rate
8.05%
Mortgage Type
New Conventional
Create a Home Valuation Report for This Property
The Home Valuation Report is an in-depth analysis detailing your home's value as well as a comparison with similar homes in the area
Home Values in the Area
Average Home Value in this Area
Purchase History
| Date | Buyer | Sale Price | Title Company |
|---|---|---|---|
| Hale Elizabeth D | $81,000 | Foundation Title Agency Inc | |
| Ten Rose Investments Ltd | $45,400 | Foundation Title Agency Inc | |
| Sylvia Woods | $72,000 | -- |
Source: Public Records
Mortgage History
| Date | Status | Borrower | Loan Amount |
|---|---|---|---|
| Open | Hale Byrow | $83,125 | |
| Closed | Hale Elizabeth D | $68,850 | |
| Previous Owner | Sylvia Woods | $70,200 | |
| Closed | Hale Elizabeth D | $8,100 |
Source: Public Records
Tax History Compared to Growth
Tax History
| Year | Tax Paid | Tax Assessment Tax Assessment Total Assessment is a certain percentage of the fair market value that is determined by local assessors to be the total taxable value of land and additions on the property. | Land | Improvement |
|---|---|---|---|---|
| 2024 | $2,121 | $47,260 | $13,900 | $33,360 |
| 2023 | $2,094 | $47,250 | $13,895 | $33,355 |
| 2022 | $1,425 | $27,480 | $7,910 | $19,570 |
| 2021 | $1,428 | $27,480 | $7,910 | $19,570 |
| 2020 | $1,430 | $27,480 | $7,910 | $19,570 |
| 2019 | $1,372 | $22,610 | $6,580 | $16,030 |
| 2018 | $1,204 | $22,610 | $6,580 | $16,030 |
| 2017 | $1,371 | $22,610 | $6,580 | $16,030 |
| 2016 | $1,145 | $17,290 | $5,110 | $12,180 |
| 2015 | $1,040 | $17,290 | $5,110 | $12,180 |
| 2014 | $1,042 | $17,290 | $5,110 | $12,180 |
| 2013 | $571 | $19,215 | $5,670 | $13,545 |
Source: Public Records
Map
Nearby Homes
- 1712 Courtright Rd
- 1817 Alcoy Dr
- 3325 E Deshler Ave
- 1850 Bostwick Rd
- 3210 E Deshler Ave
- 3457 Petzinger Rd
- 3600 Cushing Dr
- 1470 Byron Ave
- 1626 Zettler Rd
- 1371 Aven Dr
- 4106-4108 Larry Place
- 1253 Arkwood Ave
- 1727 Niagara Rd
- 2126 Rochelle Place
- 1314 S Weyant Ave
- 1303 Elderwood Ave
- 2068 Easthaven Dr
- 3733 Dort Place
- 3217 Easthaven Dr S
- 3084 Clermont Rd
- 1804 Penfield Rd E
- 1806 Penfield Ct S
- 1808 Penfield Ct S
- 1796 Penfield Rd E
- 1814 Penfield Ct S
- 1788 Penfield Rd E
- 1820 Penfield Ct S
- 1799 Penfield Rd E
- 1806 Penfield Rd E
- 1826 Penfield Ct S
- 1805 Penfield Rd E
- 3579 E Deshler Ave
- 1815 Penfield Ct S
- 1767 Courtright Rd
- 1819 Penfield Ct S
- 1807 Penfield Rd E
- 1832 Penfield Ct S
- 1810 Penfield Rd E
- 1809 Penfield Rd E