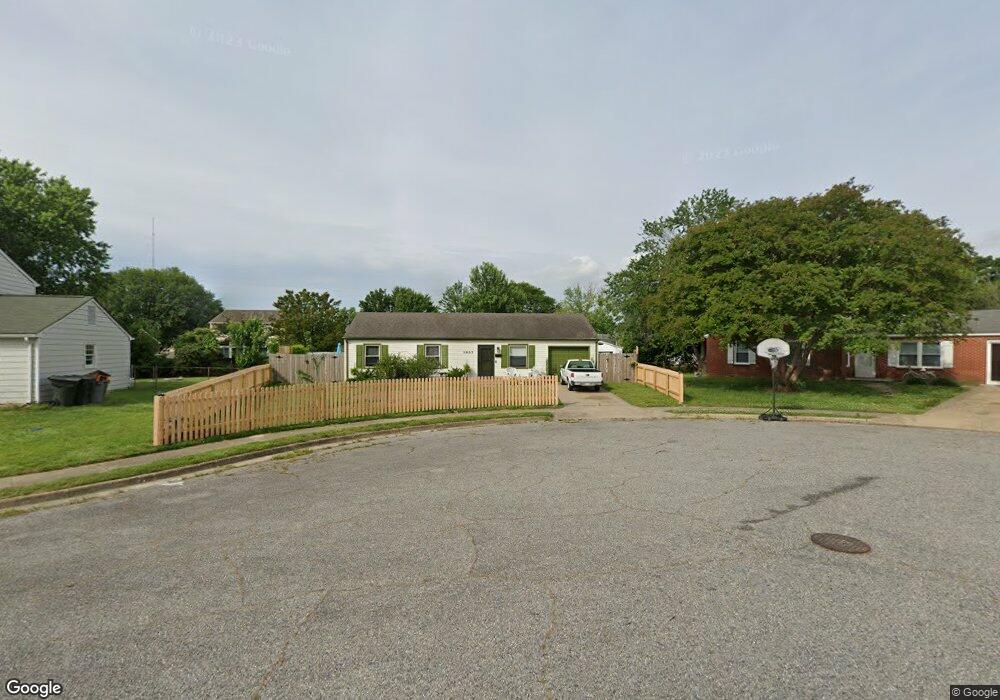
1807 Mehrens Ct Hampton, VA 23663
Buckroe Beach NeighborhoodEstimated Value: $212,000 - $230,793
3
Beds
2
Baths
975
Sq Ft
$227/Sq Ft
Est. Value
About This Home
This home is located at 1807 Mehrens Ct, Hampton, VA 23663 and is currently estimated at $220,948, approximately $226 per square foot. 1807 Mehrens Ct is a home located in Hampton City with nearby schools including Benjamin Syms Middle School, Phoebus High School, and Gloria Dei Lutheran School.
Ownership History
Date
Name
Owned For
Owner Type
Purchase Details
Closed on
Jul 1, 2021
Sold by
Chaney William Lee
Bought by
Chaney Heather Michelle and Chaney William Lee
Current Estimated Value
Purchase Details
Closed on
Nov 17, 2020
Sold by
Chaney Heather Michelle
Bought by
Chaney William Lee
Purchase Details
Closed on
Dec 20, 2018
Sold by
Yontz Lee D and Yontz Wendy L
Bought by
Chaney William L and Chaney Heather M
Home Financials for this Owner
Home Financials are based on the most recent Mortgage that was taken out on this home.
Original Mortgage
$113,898
Outstanding Balance
$101,704
Interest Rate
5.5%
Mortgage Type
FHA
Estimated Equity
$119,244
Purchase Details
Closed on
Sep 26, 2008
Sold by
Hale Michael D
Bought by
Yontz Lee D
Home Financials for this Owner
Home Financials are based on the most recent Mortgage that was taken out on this home.
Original Mortgage
$158,230
Interest Rate
6.57%
Mortgage Type
VA
Create a Home Valuation Report for This Property
The Home Valuation Report is an in-depth analysis detailing your home's value as well as a comparison with similar homes in the area
Home Values in the Area
Average Home Value in this Area
Purchase History
| Date | Buyer | Sale Price | Title Company |
|---|---|---|---|
| Chaney Heather Michelle | -- | None Available | |
| Chaney William Lee | -- | None Available | |
| Chaney William L | $116,000 | Attorney | |
| Yontz Lee D | $154,900 | -- |
Source: Public Records
Mortgage History
| Date | Status | Borrower | Loan Amount |
|---|---|---|---|
| Open | Chaney William L | $113,898 | |
| Previous Owner | Yontz Lee D | $158,230 |
Source: Public Records
Tax History Compared to Growth
Tax History
| Year | Tax Paid | Tax Assessment Tax Assessment Total Assessment is a certain percentage of the fair market value that is determined by local assessors to be the total taxable value of land and additions on the property. | Land | Improvement |
|---|---|---|---|---|
| 2025 | $2,190 | $203,400 | $55,000 | $148,400 |
| 2024 | $2,190 | $190,400 | $55,000 | $135,400 |
| 2023 | $2,078 | $166,900 | $55,000 | $111,900 |
| 2022 | $1,682 | $142,500 | $50,000 | $92,500 |
| 2021 | $1,695 | $126,200 | $38,300 | $87,900 |
| 2020 | $1,550 | $125,000 | $38,300 | $86,700 |
| 2019 | $1,550 | $125,000 | $38,300 | $86,700 |
| 2018 | $1,650 | $125,500 | $38,300 | $87,200 |
| 2017 | $1,650 | $0 | $0 | $0 |
| 2016 | $1,650 | $125,500 | $0 | $0 |
| 2015 | $1,650 | $0 | $0 | $0 |
| 2014 | $1,674 | $129,000 | $38,300 | $90,700 |
Source: Public Records
Map
Nearby Homes
- 493 Seaboard Ave
- 2108 Andrews Blvd
- 2101 Andrews Blvd
- 1914 Zinzer Rd
- 406 Atlantic Ave
- 1640 Old Buckroe Rd
- 1926 Somerville Dr
- 550 Slater Ave
- 2013 Egger Cir
- 2007 Egger Cir
- 1554 Slater Ave
- 2025 Nickerson Blvd
- 1907 Rawood Dr
- 515 Buckroe Ave
- 2002 Neville Cir
- 706 Grimes Rd
- 1685 Old Buckroe Rd
- 16 Bayview Ct
- 9 Bayview Ct
- 2000 Beall Dr
- 1805 Mehrens Ct
- 1809 Mehrens Ct
- 1806 Wigner Ct
- 1808 Wigner Ct
- 1804 Wigner Ct
- 1803 Mehrens Ct
- 1810 Mehrens Ct
- 1806 Mehrens Ct
- 1802 Wigner Ct
- 1808 Mehrens Ct
- 1804 Mehrens Ct
- 1810 Wigner Ct
- 1779 Newton Rd
- 1777 Newton Rd
- 1802 Mehrens Ct
- 1775 Newton Rd
- 1807 Wigner Ct
- 1807 Womble Ct
- 1773 Newton Rd
- 1809 Wigner Ct