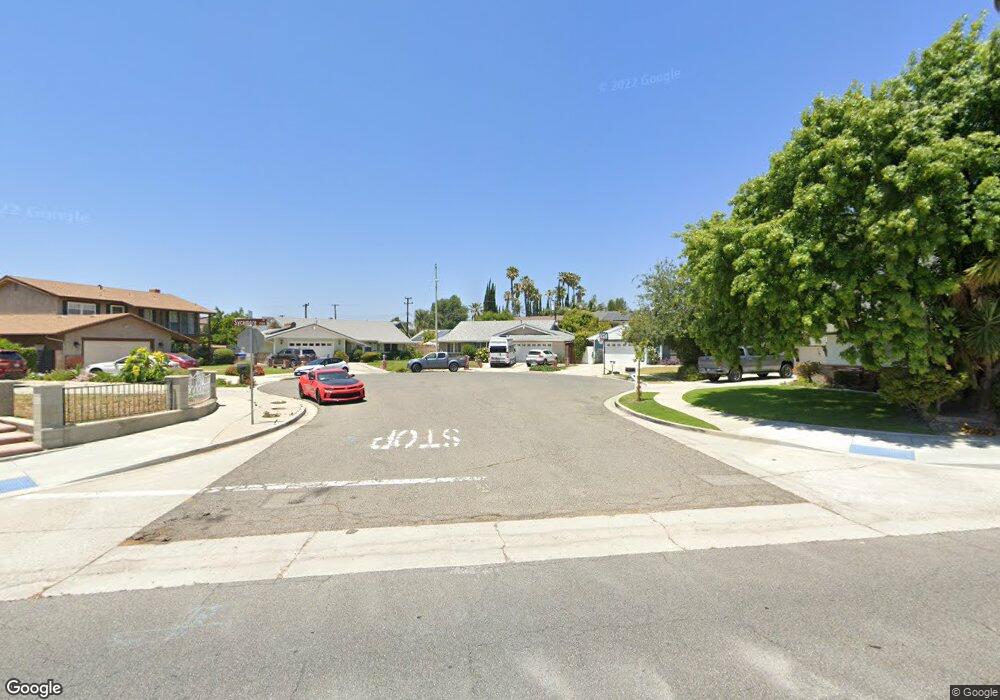
1809 Ross Cir Simi Valley, CA 93065
Central Simi Valley NeighborhoodEstimated Value: $748,000 - $790,000
3
Beds
2
Baths
1,465
Sq Ft
$531/Sq Ft
Est. Value
About This Home
This home is located at 1809 Ross Cir, Simi Valley, CA 93065 and is currently estimated at $778,048, approximately $531 per square foot. 1809 Ross Cir is a home located in Ventura County with nearby schools including Berylwood Elementary School, Hillside Middle School, and Royal High School.
Ownership History
Date
Name
Owned For
Owner Type
Purchase Details
Closed on
Feb 24, 2014
Sold by
Rick Michael and Rick Pamela M
Bought by
Rick Michael and Rick Pamela M
Current Estimated Value
Home Financials for this Owner
Home Financials are based on the most recent Mortgage that was taken out on this home.
Original Mortgage
$320,000
Interest Rate
3.33%
Mortgage Type
New Conventional
Create a Home Valuation Report for This Property
The Home Valuation Report is an in-depth analysis detailing your home's value as well as a comparison with similar homes in the area
Home Values in the Area
Average Home Value in this Area
Purchase History
| Date | Buyer | Sale Price | Title Company |
|---|---|---|---|
| Rick Michael | -- | None Available |
Source: Public Records
Mortgage History
| Date | Status | Borrower | Loan Amount |
|---|---|---|---|
| Closed | Rick Michael | $320,000 |
Source: Public Records
Tax History
| Year | Tax Paid | Tax Assessment Tax Assessment Total Assessment is a certain percentage of the fair market value that is determined by local assessors to be the total taxable value of land and additions on the property. | Land | Improvement |
|---|---|---|---|---|
| 2025 | $4,047 | $302,425 | $120,965 | $181,460 |
| 2024 | $4,047 | $296,496 | $118,594 | $177,902 |
| 2023 | $3,804 | $290,683 | $116,269 | $174,414 |
| 2022 | $3,772 | $284,984 | $113,989 | $170,995 |
| 2021 | $3,730 | $279,397 | $111,754 | $167,643 |
| 2020 | $3,643 | $276,534 | $110,609 | $165,925 |
| 2019 | $3,476 | $271,113 | $108,441 | $162,672 |
| 2018 | $3,437 | $265,798 | $106,315 | $159,483 |
| 2017 | $3,353 | $260,587 | $104,231 | $156,356 |
| 2016 | $3,200 | $255,479 | $102,188 | $153,291 |
| 2015 | $3,125 | $251,644 | $100,654 | $150,990 |
| 2014 | $3,073 | $246,716 | $98,683 | $148,033 |
Source: Public Records
Map
Nearby Homes
- 1843 Garvin Ave
- 2820 Rock St
- 1954 Claudia Ave
- 1750 Pope Ave
- 2405 Lee St
- 2399 Lee St
- 2915 Deacon St Unit 17
- 2783 Fallon Cir
- 2235 Clover St
- 2293 Lupin St
- 2325 Wisteria St
- 2371 Larch St
- 1387 Cherry Ave
- 3082 Galena Ave
- 1558 Ysrella Ave
- 2968 Royal Ave
- 2165 Malcolm St
- 2146 N Brower St
- 3297 Elmore St
- 2268 Brentwood St
- 1793 Ross Cir
- 1825 Ross Cir
- 1848 Marcella St
- 1860 Marcella St
- 1836 Marcella St
- 1816 Marcella St
- 1872 Marcella St
- 1785 Ross Cir
- 1804 Marcella St
- 1843 Ross Cir
- 1824 Marcella St
- 1859 Sycamore Dr
- 1784 Marcella St
- 1777 Ross Cir
- 1884 Marcella St
- 1750 Marcella St
- 2690 Lee St
- 1892 Marcella St
- 1716 Marcella St
- 2693 Lee St
Your Personal Tour Guide
Ask me questions while you tour the home.