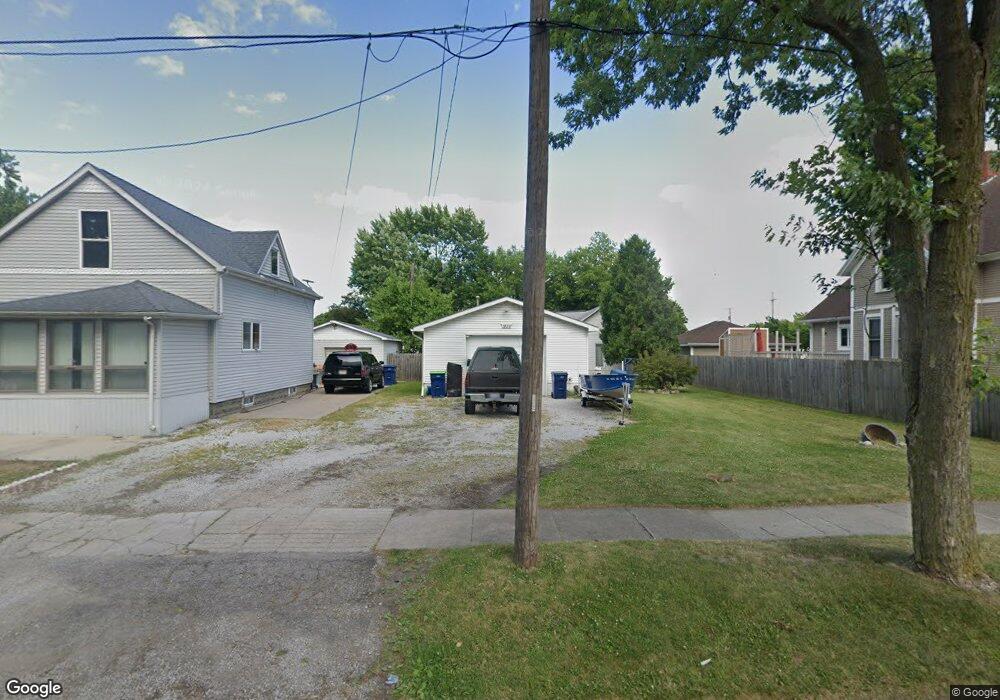
1809 S Chilson St Bay City, MI 48706
Estimated Value: $74,000 - $115,000
1
Bed
1
Bath
802
Sq Ft
$120/Sq Ft
Est. Value
About This Home
This home is located at 1809 S Chilson St, Bay City, MI 48706 and is currently estimated at $96,324, approximately $120 per square foot. 1809 S Chilson St is a home located in Bay County with nearby schools including Kolb Elementary School, Handy Middle School, and Bay City Central High School.
Ownership History
Date
Name
Owned For
Owner Type
Purchase Details
Closed on
Sep 3, 2019
Sold by
Chevalier Vincent and Chevalier Julie
Bought by
Danks Nicholas M
Current Estimated Value
Home Financials for this Owner
Home Financials are based on the most recent Mortgage that was taken out on this home.
Original Mortgage
$42,438
Outstanding Balance
$37,248
Interest Rate
3.7%
Mortgage Type
FHA
Estimated Equity
$59,076
Purchase Details
Closed on
Jun 9, 2014
Sold by
Tetil Miles M and Tetil Donna M
Bought by
Chevalier Vincent and Chevalier Julie
Purchase Details
Closed on
Feb 7, 2012
Sold by
Tetil Donna M and Dost Donna M
Bought by
Tetil Miles M and Tetil Donna M
Purchase Details
Closed on
Sep 9, 2008
Sold by
Himmelspach Daniel C
Bought by
Dost Donna M
Purchase Details
Closed on
Jun 1, 2000
Sold by
Dost Harold A and Dost Donna M
Bought by
Dost Harold A
Create a Home Valuation Report for This Property
The Home Valuation Report is an in-depth analysis detailing your home's value as well as a comparison with similar homes in the area
Home Values in the Area
Average Home Value in this Area
Purchase History
| Date | Buyer | Sale Price | Title Company |
|---|---|---|---|
| Danks Nicholas M | $43,222 | None Available | |
| Chevalier Vincent | $20,000 | None Available | |
| Tetil Miles M | -- | None Available | |
| Dost Donna M | $25,000 | None Available | |
| Dost Harold A | -- | -- |
Source: Public Records
Mortgage History
| Date | Status | Borrower | Loan Amount |
|---|---|---|---|
| Open | Danks Nicholas M | $42,438 |
Source: Public Records
Tax History Compared to Growth
Tax History
| Year | Tax Paid | Tax Assessment Tax Assessment Total Assessment is a certain percentage of the fair market value that is determined by local assessors to be the total taxable value of land and additions on the property. | Land | Improvement |
|---|---|---|---|---|
| 2025 | $1,245 | $39,150 | $0 | $0 |
| 2024 | $1,025 | $35,250 | $0 | $0 |
| 2023 | $976 | $29,950 | $0 | $0 |
| 2022 | $1,120 | $26,750 | $0 | $0 |
| 2021 | $1,054 | $25,850 | $25,850 | $0 |
| 2020 | $1,120 | $23,050 | $23,050 | $0 |
| 2019 | $1,434 | $22,800 | $0 | $0 |
| 2018 | $1,414 | $22,050 | $0 | $0 |
| 2017 | $1,384 | $20,600 | $0 | $0 |
| 2016 | $1,375 | $20,400 | $0 | $20,400 |
| 2015 | $1,334 | $21,100 | $0 | $21,100 |
| 2014 | $1,334 | $20,500 | $0 | $20,500 |
Source: Public Records
Map
Nearby Homes
- 1801 S Warner St
- 1004 S Arbor St
- 901 Germania St
- 1901 S Mountain St
- 1400 S Chilson St
- 1303 S Warner St
- 1232 S Mountain St
- 104 W Ionia St
- 512 Germania St
- 39 E Salzburg Rd
- 511 Wilson St
- 609 Mccormick St
- 3343 Parkway Dr
- 215 Stanton St
- 406 Stanton St
- 413 Franklin St
- 5381 Kasemeyer Rd
- 403 Polk St
- 5231 Parkway Dr
- 618 Stanton St
- 1811 S Chilson St
- 1807 S Chilson St
- 1805 S Chilson St
- 1803 S Chilson St
- 1808 S Chilson St
- 1806 S Chilson St
- 1810 S Chilson St
- 1804 S Chilson St
- 1900 S Chilson St
- 1900 S Erie St
- 1801 S Chilson St
- 1802 S Chilson St
- 304 W Ivy St
- 1800 S Chilson St
- 201 W Chestnut St
- 1809 S Erie St
- 1807 S Erie St
- 106 W Ivy St
- 1807 S Warner St
- 1902 S Chilson St