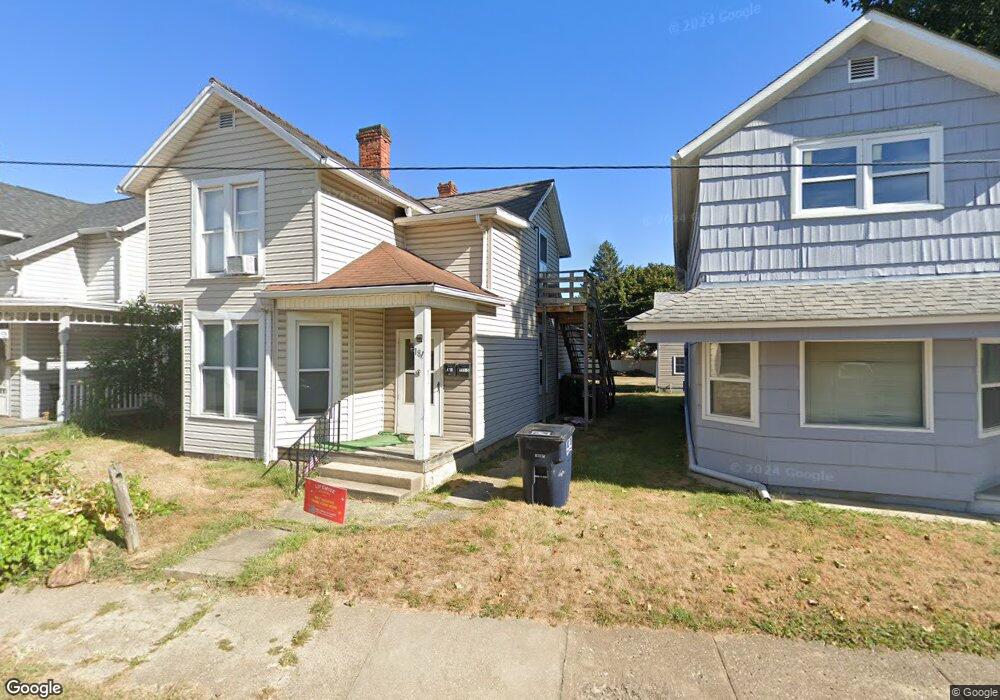
181 E Allen St Lancaster, OH 43130
Estimated Value: $169,000 - $195,885
2
Beds
1
Bath
1,605
Sq Ft
$113/Sq Ft
Est. Value
About This Home
This home is located at 181 E Allen St, Lancaster, OH 43130 and is currently estimated at $180,721, approximately $112 per square foot. 181 E Allen St is a home located in Fairfield County with nearby schools including Thomas Ewing Junior High School, Lancaster High School, and St Mary Elementary School.
Ownership History
Date
Name
Owned For
Owner Type
Purchase Details
Closed on
Aug 30, 2010
Sold by
Fannie Mae
Bought by
Sanbar Llc
Current Estimated Value
Purchase Details
Closed on
Mar 22, 2010
Sold by
Shekas Stephen G
Bought by
Federal National Mortgage Association
Purchase Details
Closed on
Sep 8, 2008
Sold by
Archstone Investments Llc
Bought by
Archstone Technology Llc
Purchase Details
Closed on
Feb 1, 2005
Sold by
Shekas Stephen G and Shekas Andrew M
Bought by
Archstone Investments Llc
Purchase Details
Closed on
Sep 26, 2003
Sold by
Barker Ronald E and Barker Victoria M
Bought by
Shekas Stephen G and Shekas Andrew M
Home Financials for this Owner
Home Financials are based on the most recent Mortgage that was taken out on this home.
Original Mortgage
$79,300
Interest Rate
6.33%
Mortgage Type
Purchase Money Mortgage
Purchase Details
Closed on
Oct 1, 1990
Create a Home Valuation Report for This Property
The Home Valuation Report is an in-depth analysis detailing your home's value as well as a comparison with similar homes in the area
Home Values in the Area
Average Home Value in this Area
Purchase History
| Date | Buyer | Sale Price | Title Company |
|---|---|---|---|
| Sanbar Llc | $43,900 | None Available | |
| Federal National Mortgage Association | $70,280 | None Available | |
| Archstone Technology Llc | -- | None Available | |
| Archstone Investments Llc | -- | -- | |
| Shekas Stephen G | $83,500 | Hocking Valley Title Agency | |
| -- | $14,000 | -- |
Source: Public Records
Mortgage History
| Date | Status | Borrower | Loan Amount |
|---|---|---|---|
| Previous Owner | Shekas Stephen G | $79,300 |
Source: Public Records
Tax History
| Year | Tax Paid | Tax Assessment Tax Assessment Total Assessment is a certain percentage of the fair market value that is determined by local assessors to be the total taxable value of land and additions on the property. | Land | Improvement |
|---|---|---|---|---|
| 2025 | $3,303 | $49,210 | $10,830 | $38,380 |
| 2024 | $3,303 | $36,740 | $4,710 | $32,030 |
| 2023 | $1,365 | $36,740 | $4,710 | $32,030 |
| 2022 | $1,373 | $36,740 | $4,710 | $32,030 |
| 2021 | $1,136 | $28,490 | $4,710 | $23,780 |
| 2020 | $1,090 | $28,490 | $4,710 | $23,780 |
| 2019 | $1,037 | $28,490 | $4,710 | $23,780 |
| 2018 | $895 | $22,930 | $4,710 | $18,220 |
| 2017 | $895 | $23,320 | $5,100 | $18,220 |
| 2016 | $872 | $23,320 | $5,100 | $18,220 |
| 2015 | $867 | $22,510 | $5,100 | $17,410 |
| 2014 | $827 | $22,510 | $5,100 | $17,410 |
| 2013 | $827 | $22,510 | $5,100 | $17,410 |
Source: Public Records
Map
Nearby Homes
- 600 N High St
- 233 E 6th Ave
- 311 E Allen St
- 165 Lake St
- 820 N Broad St
- 123 Arnold Ave
- 130 W Fair Ave
- 517 N Maple St
- 526 N Columbus St
- 515 N Columbus St
- 249 N Pearl Ave
- 233 Union St
- 547 E Mulberry St
- 336 Reber Ave
- 641 King St
- 154 E Main St
- 705 Madison Ave
- 1156 Forest Rose Ave
- 621 E Mulberry St
- 330 Park St
Your Personal Tour Guide
Ask me questions while you tour the home.