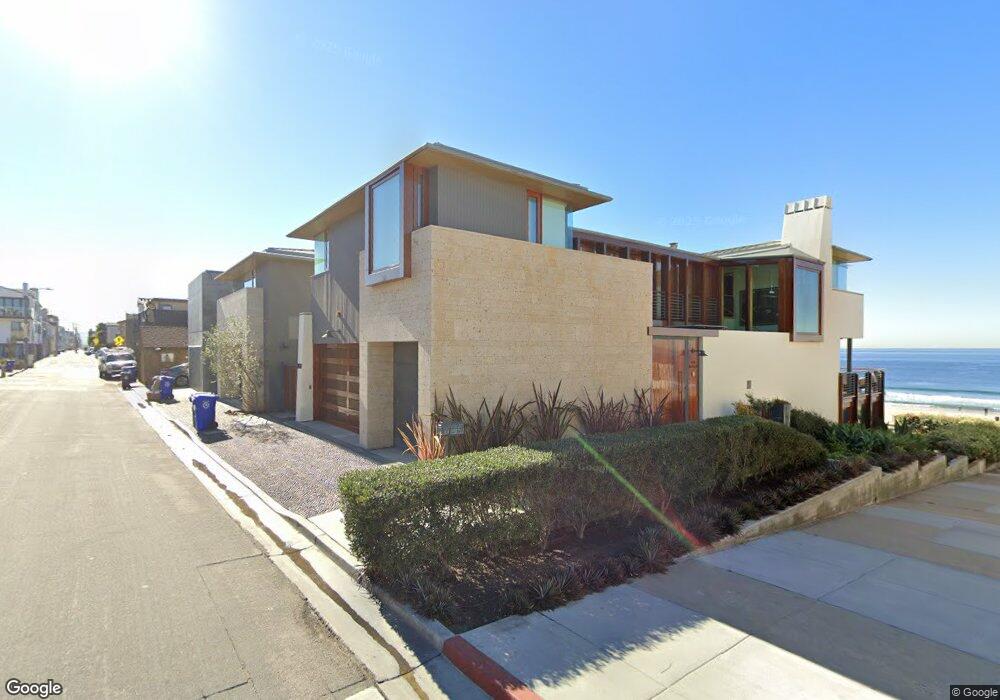
1816 The Strand Manhattan Beach, CA 90266
Estimated Value: $7,348,000 - $14,039,098
5
Beds
5
Baths
4,156
Sq Ft
$2,458/Sq Ft
Est. Value
About This Home
This home is located at 1816 The Strand, Manhattan Beach, CA 90266 and is currently estimated at $10,217,366, approximately $2,458 per square foot. 1816 The Strand is a home located in Los Angeles County with nearby schools including Grand View Elementary School, Manhattan Beach Middle School, and Mira Costa High School.
Ownership History
Date
Name
Owned For
Owner Type
Purchase Details
Closed on
Jan 28, 2014
Sold by
Jones G Bradford
Bought by
Jones G Bradford and G Bradford Jones Living Trust
Current Estimated Value
Purchase Details
Closed on
Jan 23, 2014
Sold by
Jones G Bradford
Bought by
Jones G Bradford
Purchase Details
Closed on
Jun 7, 2001
Sold by
Kronfli Paul
Bought by
Jones G Bradford and Jones Joan Hood
Purchase Details
Closed on
Dec 15, 2000
Sold by
Kronfli Paul
Bought by
Kronfli Paul
Home Financials for this Owner
Home Financials are based on the most recent Mortgage that was taken out on this home.
Original Mortgage
$2,000,000
Interest Rate
7.81%
Purchase Details
Closed on
Apr 27, 1998
Sold by
Kronfli Hoda
Bought by
Kronfli Paul
Create a Home Valuation Report for This Property
The Home Valuation Report is an in-depth analysis detailing your home's value as well as a comparison with similar homes in the area
Home Values in the Area
Average Home Value in this Area
Purchase History
| Date | Buyer | Sale Price | Title Company |
|---|---|---|---|
| Jones G Bradford | -- | None Available | |
| Jones G Bradford | -- | None Available | |
| Jones G Bradford | -- | None Available | |
| Jones G Bradford | $3,500,000 | Lawyers Title Company | |
| Kronfli Paul | -- | Fidelity National Title Co | |
| Kronfli Paul | -- | -- | |
| Kronfli Paul | -- | -- |
Source: Public Records
Mortgage History
| Date | Status | Borrower | Loan Amount |
|---|---|---|---|
| Previous Owner | Kronfli Paul | $2,000,000 |
Source: Public Records
Tax History
| Year | Tax Paid | Tax Assessment Tax Assessment Total Assessment is a certain percentage of the fair market value that is determined by local assessors to be the total taxable value of land and additions on the property. | Land | Improvement |
|---|---|---|---|---|
| 2025 | $110,268 | $10,004,882 | $5,397,348 | $4,607,534 |
| 2024 | $110,268 | $9,808,709 | $5,291,518 | $4,517,191 |
| 2023 | $107,516 | $9,616,382 | $5,187,763 | $4,428,619 |
| 2022 | $105,632 | $9,427,827 | $5,086,043 | $4,341,784 |
| 2021 | $103,597 | $9,242,968 | $4,986,317 | $4,256,651 |
| 2019 | $100,775 | $8,968,819 | $4,838,421 | $4,130,398 |
| 2018 | $98,872 | $8,792,960 | $4,743,550 | $4,049,410 |
| 2016 | $92,736 | $8,451,520 | $4,559,353 | $3,892,167 |
| 2015 | $90,796 | $8,324,572 | $4,490,868 | $3,833,704 |
| 2014 | $89,462 | $8,161,507 | $4,402,899 | $3,758,608 |
Source: Public Records
Map
Nearby Homes
- 1812 Ocean Dr
- 1920 The Strand
- 220 20th St
- 2007 Highland Ave
- 324 18th St
- 137 15th St
- 2200 The Strand Unit A
- 2200 The Strand Unit B
- 2208 The Strand
- 1304 The Strand Unit A
- 2407 Manhattan Ave
- 2420 The Strand
- 425 23rd Place
- 521 13th St
- 1940 N Ardmore Ave
- 624 14th St
- 661 19th St
- 124 11th St
- 461 26th St
- 605 Marine Ave
- 1820 The Strand
- 1806 The Strand
- 1804 The Strand
- 112 19th St Unit Beach Bungalow
- 112 19th St Unit 112 19th Street
- 112 19th St
- 1900 The Strand
- 115 18th Place
- 116 19th St
- 1800 The Strand
- 1802 Ocean Dr
- 1904 The Strand
- 113 19th St
- 120 19th St
- 117 19th St
- 117 18th St
- 1908 The Strand
- 112 19th Place
- 124 19th St
- 1904 Ocean Dr
Your Personal Tour Guide
Ask me questions while you tour the home.