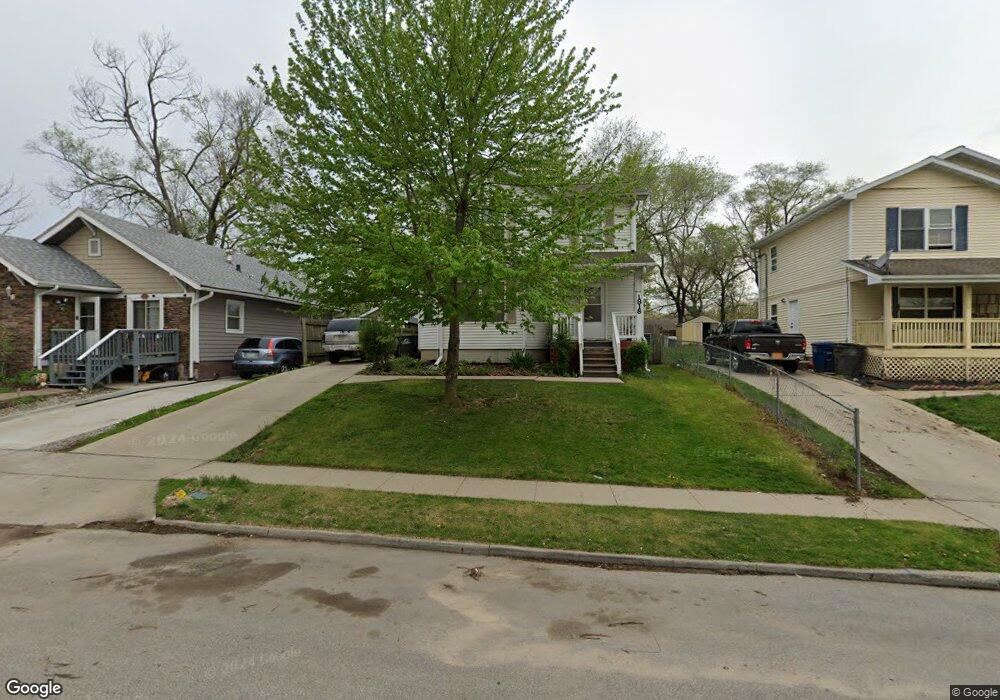
1818 11th St Des Moines, IA 50314
King Irving NeighborhoodEstimated Value: $139,000 - $185,000
3
Beds
2
Baths
1,283
Sq Ft
$126/Sq Ft
Est. Value
About This Home
This home is located at 1818 11th St, Des Moines, IA 50314 and is currently estimated at $161,394, approximately $125 per square foot. 1818 11th St is a home located in Polk County with nearby schools including Moulton Elementary School, Harding Middle School, and North High School.
Ownership History
Date
Name
Owned For
Owner Type
Purchase Details
Closed on
Sep 28, 2007
Sold by
Greater Des Moines Habitat For Humanity
Bought by
Aywak Olwak Chol and Amun Margrat
Current Estimated Value
Home Financials for this Owner
Home Financials are based on the most recent Mortgage that was taken out on this home.
Original Mortgage
$44,000
Outstanding Balance
$7,364
Interest Rate
6.5%
Mortgage Type
Stand Alone Second
Estimated Equity
$154,030
Purchase Details
Closed on
Nov 13, 2006
Sold by
Alas Emilio and Alas Maria
Bought by
Greater Des Moines Habitat For Humanity
Purchase Details
Closed on
Apr 29, 2003
Sold by
Hannah Acquisitions Llc
Bought by
Alas Emilio and Alas Maria
Purchase Details
Closed on
Feb 25, 2003
Sold by
Iowa Hearthside Investors Llc
Bought by
Hannah Acquisitions Llc
Purchase Details
Closed on
Jun 5, 1998
Sold by
Maloney Mary
Bought by
Holtz John
Create a Home Valuation Report for This Property
The Home Valuation Report is an in-depth analysis detailing your home's value as well as a comparison with similar homes in the area
Home Values in the Area
Average Home Value in this Area
Purchase History
| Date | Buyer | Sale Price | Title Company |
|---|---|---|---|
| Aywak Olwak Chol | $80,500 | None Available | |
| Greater Des Moines Habitat For Humanity | $5,500 | None Available | |
| Alas Emilio | $4,500 | -- | |
| Hannah Acquisitions Llc | -- | -- | |
| Holtz John | -- | -- |
Source: Public Records
Mortgage History
| Date | Status | Borrower | Loan Amount |
|---|---|---|---|
| Open | Aywak Olwak Chol | $44,000 | |
| Open | Aywak Olwak Chol | $80,662 |
Source: Public Records
Tax History Compared to Growth
Tax History
| Year | Tax Paid | Tax Assessment Tax Assessment Total Assessment is a certain percentage of the fair market value that is determined by local assessors to be the total taxable value of land and additions on the property. | Land | Improvement |
|---|---|---|---|---|
| 2025 | $2,524 | $160,400 | $13,700 | $146,700 |
| 2024 | $2,524 | $138,800 | $11,700 | $127,100 |
| 2023 | $2,226 | $138,800 | $11,700 | $127,100 |
| 2022 | $2,206 | $103,300 | $8,900 | $94,400 |
| 2021 | $2,084 | $103,300 | $8,900 | $94,400 |
| 2020 | $2,160 | $92,100 | $7,900 | $84,200 |
| 2019 | $2,160 | $92,100 | $7,900 | $84,200 |
| 2018 | $0 | $84,100 | $7,100 | $77,000 |
| 2017 | $0 | $84,100 | $7,100 | $77,000 |
| 2016 | $0 | $85,300 | $7,000 | $78,300 |
| 2015 | $0 | $85,300 | $7,000 | $78,300 |
| 2014 | -- | $81,600 | $7,500 | $74,100 |
Source: Public Records
Map
Nearby Homes