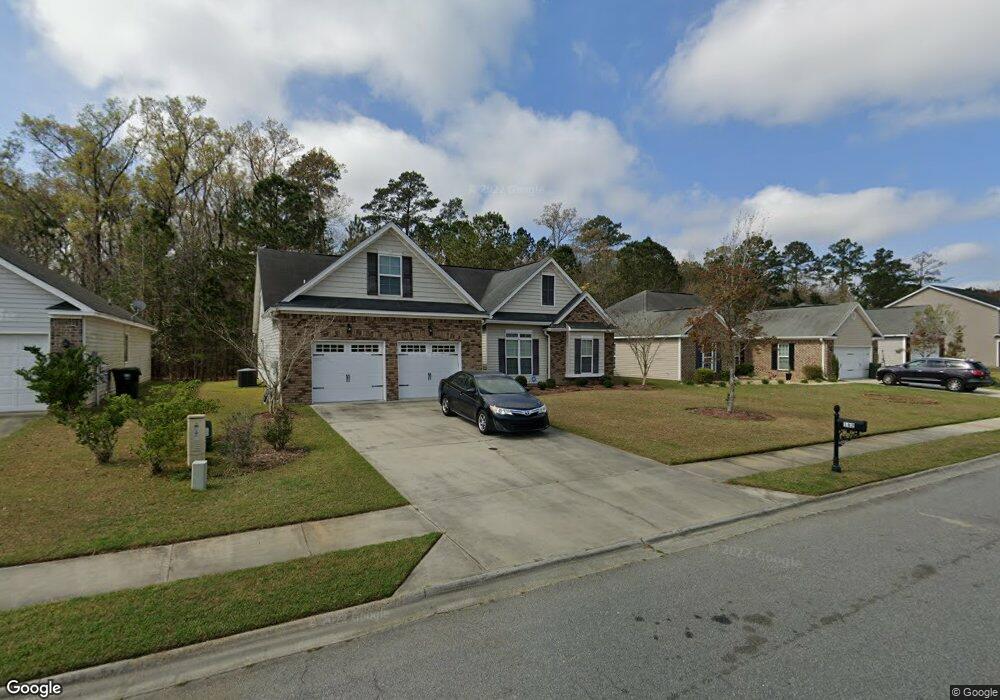
182 Carlisle Way Savannah, GA 31419
Berwick NeighborhoodEstimated Value: $372,435 - $414,000
4
Beds
3
Baths
2,118
Sq Ft
$185/Sq Ft
Est. Value
About This Home
This home is located at 182 Carlisle Way, Savannah, GA 31419 and is currently estimated at $390,859, approximately $184 per square foot. 182 Carlisle Way is a home located in Chatham County with nearby schools including Gould Elementary School and West Chatham Middle School.
Ownership History
Date
Name
Owned For
Owner Type
Purchase Details
Closed on
Sep 1, 2010
Sold by
Jerry C Wardlaw Construction
Bought by
Flores Danuel C and Flores Antonio M
Current Estimated Value
Home Financials for this Owner
Home Financials are based on the most recent Mortgage that was taken out on this home.
Original Mortgage
$229,000
Outstanding Balance
$151,238
Interest Rate
4.52%
Mortgage Type
VA
Estimated Equity
$239,621
Purchase Details
Closed on
Mar 23, 2007
Sold by
Not Provided
Bought by
Flores Danuel C and Flores Antonio M
Create a Home Valuation Report for This Property
The Home Valuation Report is an in-depth analysis detailing your home's value as well as a comparison with similar homes in the area
Home Values in the Area
Average Home Value in this Area
Purchase History
| Date | Buyer | Sale Price | Title Company |
|---|---|---|---|
| Flores Danuel C | $229,000 | -- | |
| Flores Danuel C | $229,000 | -- | |
| Flores Danuel C | $1,404,000 | -- |
Source: Public Records
Mortgage History
| Date | Status | Borrower | Loan Amount |
|---|---|---|---|
| Open | Flores Danuel C | $229,000 | |
| Closed | Flores Danuel C | $229,000 |
Source: Public Records
Tax History Compared to Growth
Tax History
| Year | Tax Paid | Tax Assessment Tax Assessment Total Assessment is a certain percentage of the fair market value that is determined by local assessors to be the total taxable value of land and additions on the property. | Land | Improvement |
|---|---|---|---|---|
| 2025 | $3,432 | $144,240 | $23,200 | $121,040 |
| 2024 | $3,432 | $144,520 | $23,200 | $121,320 |
| 2023 | $2,584 | $136,640 | $23,200 | $113,440 |
| 2022 | $2,974 | $110,880 | $20,160 | $90,720 |
| 2021 | $2,967 | $92,880 | $12,960 | $79,920 |
| 2020 | $3,096 | $90,400 | $12,960 | $77,440 |
| 2019 | $3,245 | $84,840 | $12,960 | $71,880 |
| 2018 | $3,148 | $82,000 | $12,960 | $69,040 |
| 2017 | $3,377 | $91,440 | $12,960 | $78,480 |
| 2016 | $3,120 | $90,440 | $12,960 | $77,480 |
| 2015 | $3,157 | $91,400 | $12,960 | $78,440 |
| 2014 | $4,573 | $92,400 | $0 | $0 |
Source: Public Records
Map
Nearby Homes
- 161 Carlisle Way
- 143 Carlisle Way
- 120 Carlisle Way
- 6 Carlisle Ln
- 76 Carlisle Ln
- 46 Harvest Moon Dr
- 49 Carlisle Ln
- 830 Granite Ln
- 801 Granite Ln
- 1 Great Oak Trail
- 7 Sandstone Ct
- 41 Quartz Way
- 744 Canyon Dr
- 139 Chapel Lake S
- 13 Copper Ct
- 114 Chapel Lake S
- 198 Chapel Lake S
- 101 Travertine Cir
- 7 Tee Tree Cir
- 124 Slate Cir
- 180 Carlisle Way
- 186 Carlisle Way
- 178 Carlisle Way
- 183 Carlisle Way Unit LOT 137
- 176 Carlisle Way
- 188 Carlisle Way
- 29 Castle Hill Rd
- 185 Carlisle Way
- 174 Carlisle Way
- 27 Castle Hill Rd
- 190 Carlisle Way
- 187 Carlisle Way
- 167 Carlisle Way
- 28 Castle Hill Rd
- 172 Carlisle Way
- 189 Carlisle Way
- 25 Castle Hill Rd
- 192 Carlisle Way
- 26 Castle Hill Rd
- 165 Carlisle Way