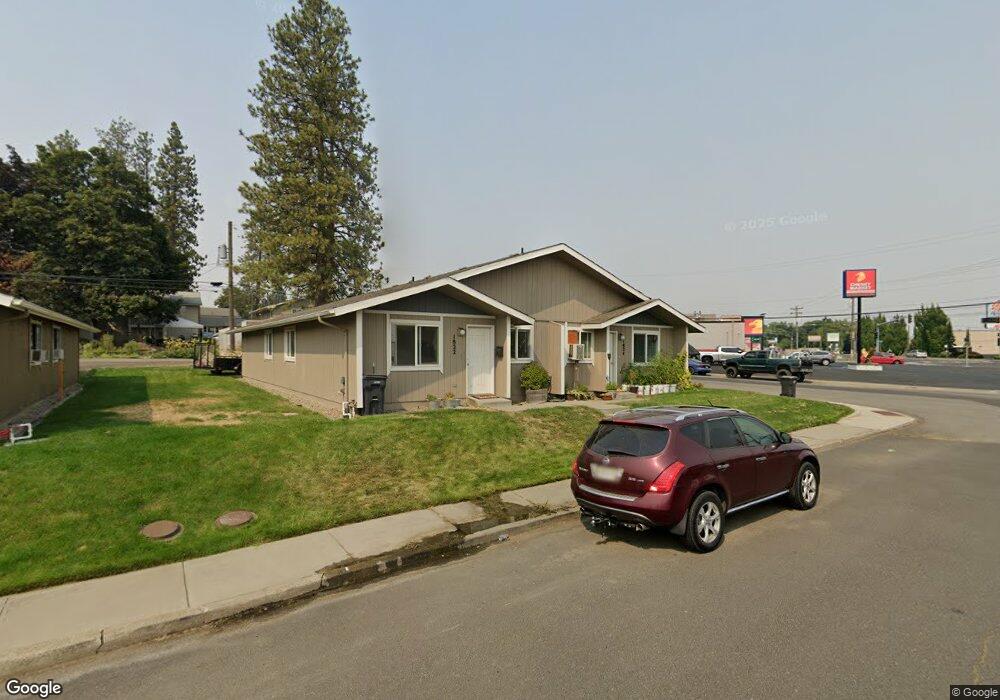
1822 3rd St Cheney, WA 99004
Estimated Value: $304,000 - $327,000
4
Beds
2
Baths
1,672
Sq Ft
$190/Sq Ft
Est. Value
About This Home
This home is located at 1822 3rd St, Cheney, WA 99004 and is currently estimated at $317,747, approximately $190 per square foot. 1822 3rd St is a home located in Spokane County with nearby schools including Betz Elementary School, Cheney Middle School, and Cheney High School.
Ownership History
Date
Name
Owned For
Owner Type
Purchase Details
Closed on
Apr 10, 2017
Sold by
Solomon Michelle M
Bought by
Solomon John A
Current Estimated Value
Purchase Details
Closed on
Apr 27, 2007
Sold by
Solomon John R and Solomon Maxine L
Bought by
Solomon John A and Solomon Michelle M
Home Financials for this Owner
Home Financials are based on the most recent Mortgage that was taken out on this home.
Original Mortgage
$122,400
Outstanding Balance
$72,529
Interest Rate
6.15%
Mortgage Type
Purchase Money Mortgage
Estimated Equity
$245,218
Create a Home Valuation Report for This Property
The Home Valuation Report is an in-depth analysis detailing your home's value as well as a comparison with similar homes in the area
Purchase History
| Date | Buyer | Sale Price | Title Company |
|---|---|---|---|
| Solomon John A | -- | None Available | |
| Solomon John A | $153,000 | Transnation Title Ins Co |
Source: Public Records
Mortgage History
| Date | Status | Borrower | Loan Amount |
|---|---|---|---|
| Open | Solomon John A | $122,400 |
Source: Public Records
Tax History
| Year | Tax Paid | Tax Assessment Tax Assessment Total Assessment is a certain percentage of the fair market value that is determined by local assessors to be the total taxable value of land and additions on the property. | Land | Improvement |
|---|---|---|---|---|
| 2025 | $3,219 | $303,200 | $70,000 | $233,200 |
| 2024 | $3,219 | $291,800 | $75,000 | $216,800 |
| 2023 | $2,303 | $257,100 | $75,000 | $182,100 |
| 2022 | $2,238 | $274,500 | $75,000 | $199,500 |
| 2021 | $2,097 | $183,100 | $31,500 | $151,600 |
| 2020 | $2,044 | $167,300 | $30,000 | $137,300 |
| 2019 | $1,821 | $156,800 | $28,000 | $128,800 |
| 2018 | $2,039 | $152,900 | $28,000 | $124,900 |
| 2017 | $1,762 | $145,900 | $28,000 | $117,900 |
| 2016 | $1,696 | $135,300 | $28,000 | $107,300 |
| 2015 | $1,637 | $132,800 | $28,000 | $104,800 |
| 2014 | -- | $132,800 | $28,000 | $104,800 |
| 2013 | -- | $0 | $0 | $0 |
Source: Public Records
Map
Nearby Homes
- 1717 2nd St
- 1721 5th St
- 1626 5th St
- 1422 4th St
- 302 Peach Tree Ct
- 302 Plum Tree Ct Unit Lot 18 Block 3 - Hud
- 314 Plum Tree Ct Unit Lot 20 Block 3 - Sno
- 318 Plum Tree Ct Unit Lot 10 Block 3 - Sno
- 301 Plum Tree Ct Unit Lot 6 Block 3 - Snow
- 307 Peach Tree Ct
- 323 Peach Tree Ct
- 311 Peach Tree Ct
- 329 Peach Tree Ct Unit Lot 1 Block 3 - Snow
- 313 Apple Tree Ct
- 1239 1st St
- 305 Plum Tree Ct Unit Lot 17 Block 3 - Wat
- 305 Plum Tree Ct Unit Lot 8 Block 3 - Wate
- 5339 W Anderson Rd
- 317 Peach Tree Ct
- 308 Apple Tree Ct Unit Lot 19 Block 3 - Sno
Your Personal Tour Guide
Ask me questions while you tour the home.