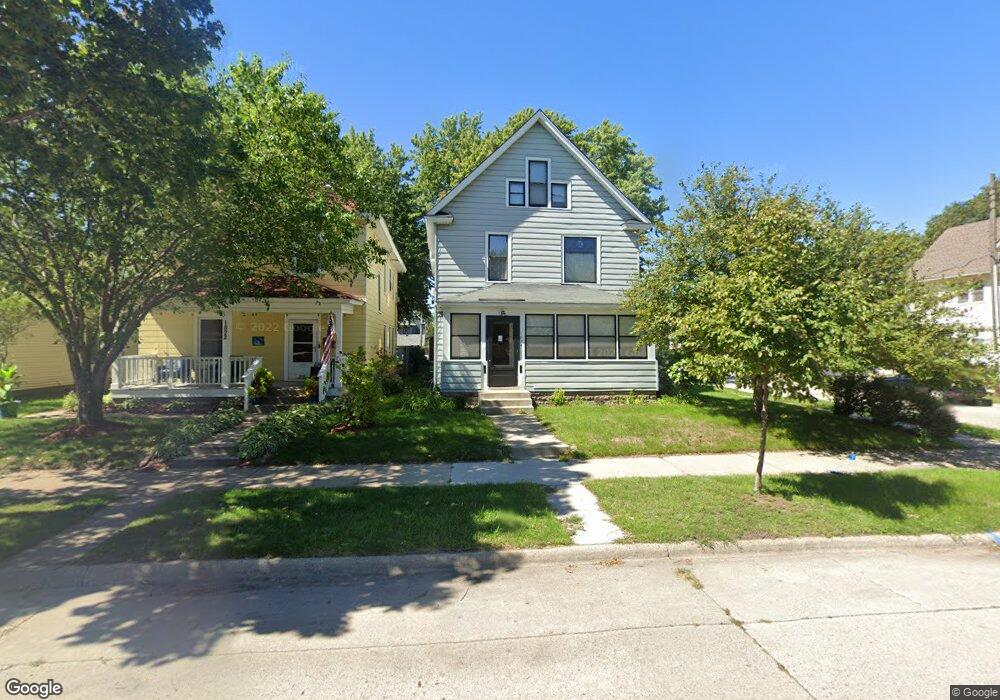
1824 Fillmore St NE Minneapolis, MN 55418
Windom Park NeighborhoodEstimated Value: $448,000 - $494,000
3
Beds
2
Baths
2,472
Sq Ft
$190/Sq Ft
Est. Value
About This Home
This home is located at 1824 Fillmore St NE, Minneapolis, MN 55418 and is currently estimated at $470,236, approximately $190 per square foot. 1824 Fillmore St NE is a home located in Hennepin County with nearby schools including Pillsbury Elementary School, Northeast Middle School, and Thomas Edison High School.
Ownership History
Date
Name
Owned For
Owner Type
Purchase Details
Closed on
Aug 2, 2021
Sold by
Phipps John W and Phipps Janet M
Bought by
Dang Vinh
Current Estimated Value
Home Financials for this Owner
Home Financials are based on the most recent Mortgage that was taken out on this home.
Original Mortgage
$420,481
Outstanding Balance
$382,347
Interest Rate
2.9%
Mortgage Type
FHA
Estimated Equity
$87,889
Purchase Details
Closed on
May 1, 2015
Sold by
Coyne Molly J
Bought by
Phipps Janet M and Phipps John W
Home Financials for this Owner
Home Financials are based on the most recent Mortgage that was taken out on this home.
Original Mortgage
$255,290
Interest Rate
4.12%
Mortgage Type
FHA
Purchase Details
Closed on
Aug 31, 2000
Sold by
Davis Charles E
Bought by
Coyne Molly J and Macnabb Thomas O
Create a Home Valuation Report for This Property
The Home Valuation Report is an in-depth analysis detailing your home's value as well as a comparison with similar homes in the area
Home Values in the Area
Average Home Value in this Area
Purchase History
| Date | Buyer | Sale Price | Title Company |
|---|---|---|---|
| Dang Vinh | $435,000 | Titlesmart Inc | |
| Phipps Janet M | $260,000 | Edina Realty Title Inc | |
| Coyne Molly J | $148,000 | -- | |
| Dang Vinh Vinh | $435,000 | -- |
Source: Public Records
Mortgage History
| Date | Status | Borrower | Loan Amount |
|---|---|---|---|
| Open | Dang Vinh | $420,481 | |
| Previous Owner | Phipps Janet M | $255,290 | |
| Closed | Dang Vinh Vinh | $420,481 |
Source: Public Records
Tax History Compared to Growth
Tax History
| Year | Tax Paid | Tax Assessment Tax Assessment Total Assessment is a certain percentage of the fair market value that is determined by local assessors to be the total taxable value of land and additions on the property. | Land | Improvement |
|---|---|---|---|---|
| 2024 | $6,804 | $462,000 | $130,000 | $332,000 |
| 2023 | $6,148 | $471,000 | $130,000 | $341,000 |
| 2022 | $5,603 | $426,000 | $127,000 | $299,000 |
| 2021 | $5,972 | $405,000 | $62,000 | $343,000 |
| 2020 | $5,681 | $400,500 | $71,000 | $329,500 |
| 2019 | $5,347 | $351,500 | $47,300 | $304,200 |
| 2018 | $4,892 | $319,500 | $47,300 | $272,200 |
| 2017 | $3,660 | $250,500 | $43,000 | $207,500 |
| 2016 | $4,457 | $230,500 | $43,000 | $187,500 |
| 2015 | -- | $200,500 | $43,000 | $157,500 |
| 2014 | -- | $174,500 | $43,000 | $131,500 |
Source: Public Records
Map
Nearby Homes
- 1834 Fillmore St NE
- 1811 Polk St NE
- 1847 Buchanan St NE
- 1415 18th Ave NE
- 1010 23rd Ave NE
- 1943 Lincoln St NE
- 1602 Johnson St NE
- 823 20th Ave NE
- 909 22nd Ave NE
- 2307 Fillmore St NE
- 2219 Lincoln St NE
- 2209 Jackson St NE
- 1104 24th Ave NE
- 916 14th Ave NE
- 2639 NE Jackson St
- 1919 Monroe St NE
- 1711 22nd Ave NE
- 1921 Hayes St NE
- 1937 Hayes St NE
- 1701 Madison St NE Unit 309
- 1822 Fillmore St NE
- 1818 Fillmore St NE
- 1828 Fillmore St NE
- 1115 18 1/2 Ave NE
- 1115 18 1 2 Ave NE
- 1814 Fillmore St NE
- 1113 18 1/2 Ave NE
- 1113 18 1 2 Ave NE
- 1810 Fillmore St NE
- 1823 Taylor St NE
- 1838 Fillmore St NE
- 1109 18 1/2 Ave NE
- 1819 Taylor St NE
- 1825 Taylor St NE
- 1825 Taylor St NE Unit 2
- 1821 Fillmore St NE
- 1825 Fillmore St NE
- 1819 Fillmore St NE
- 1806 Fillmore St NE
- 1815 Taylor St NE