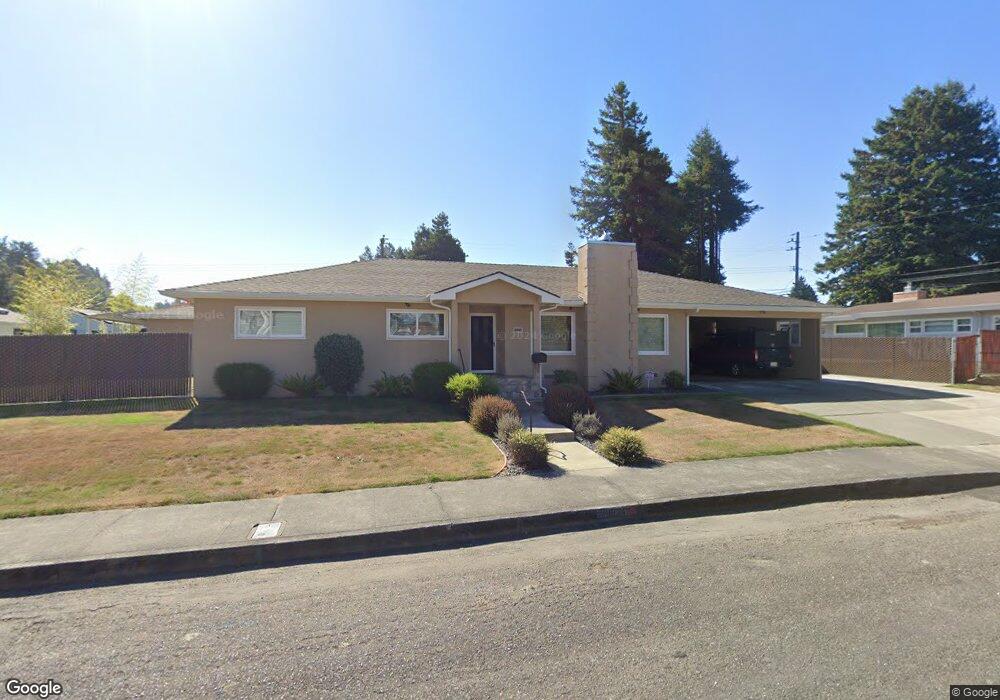
1824 Hayes St Eureka, CA 95501
Buhne Street-Harrison Avenue NeighborhoodEstimated Value: $447,000 - $491,581
3
Beds
2
Baths
1,706
Sq Ft
$278/Sq Ft
Est. Value
About This Home
This home is located at 1824 Hayes St, Eureka, CA 95501 and is currently estimated at $474,145, approximately $277 per square foot. 1824 Hayes St is a home located in Humboldt County with nearby schools including Washington Elementary School, Catherine L. Zane Middle School, and Eureka Senior High School.
Ownership History
Date
Name
Owned For
Owner Type
Purchase Details
Closed on
May 7, 2025
Sold by
Kowell Michael P and Kowell Zenda M
Bought by
Michael And Zenda Kowell 2025 Trust and Kowell
Current Estimated Value
Purchase Details
Closed on
May 8, 2013
Sold by
Hadley Chapman Patricia and Hadley Family Trust
Bought by
Kowell Michael P and Kowell Zenda M
Purchase Details
Closed on
Nov 26, 2002
Sold by
Hadley Leland W and Hadley Christine C
Bought by
Hadley Leland W and Hadley Family Trust
Create a Home Valuation Report for This Property
The Home Valuation Report is an in-depth analysis detailing your home's value as well as a comparison with similar homes in the area
Home Values in the Area
Average Home Value in this Area
Purchase History
| Date | Buyer | Sale Price | Title Company |
|---|---|---|---|
| Michael And Zenda Kowell 2025 Trust | -- | None Listed On Document | |
| Kowell Michael P | $235,000 | Humboldt Land Title Company | |
| Hadley Leland W | -- | -- |
Source: Public Records
Tax History
| Year | Tax Paid | Tax Assessment Tax Assessment Total Assessment is a certain percentage of the fair market value that is determined by local assessors to be the total taxable value of land and additions on the property. | Land | Improvement |
|---|---|---|---|---|
| 2025 | $3,001 | $291,666 | $150,906 | $140,760 |
| 2024 | $3,001 | $286,077 | $147,948 | $138,129 |
| 2023 | $2,959 | $280,517 | $145,048 | $135,469 |
| 2022 | $3,034 | $271,624 | $142,204 | $129,420 |
| 2021 | $2,842 | $266,346 | $139,416 | $126,930 |
| 2020 | $2,821 | $263,656 | $137,987 | $125,669 |
| 2019 | $2,759 | $258,105 | $135,282 | $122,823 |
| 2018 | $2,718 | $253,094 | $132,630 | $120,464 |
| 2017 | $2,705 | $248,181 | $130,030 | $118,151 |
| 2016 | $2,707 | $243,415 | $127,481 | $115,934 |
| 2015 | $2,684 | $239,868 | $125,567 | $114,301 |
| 2014 | $2,549 | $238,876 | $125,567 | $113,309 |
Source: Public Records
Map
Nearby Homes
Your Personal Tour Guide
Ask me questions while you tour the home.