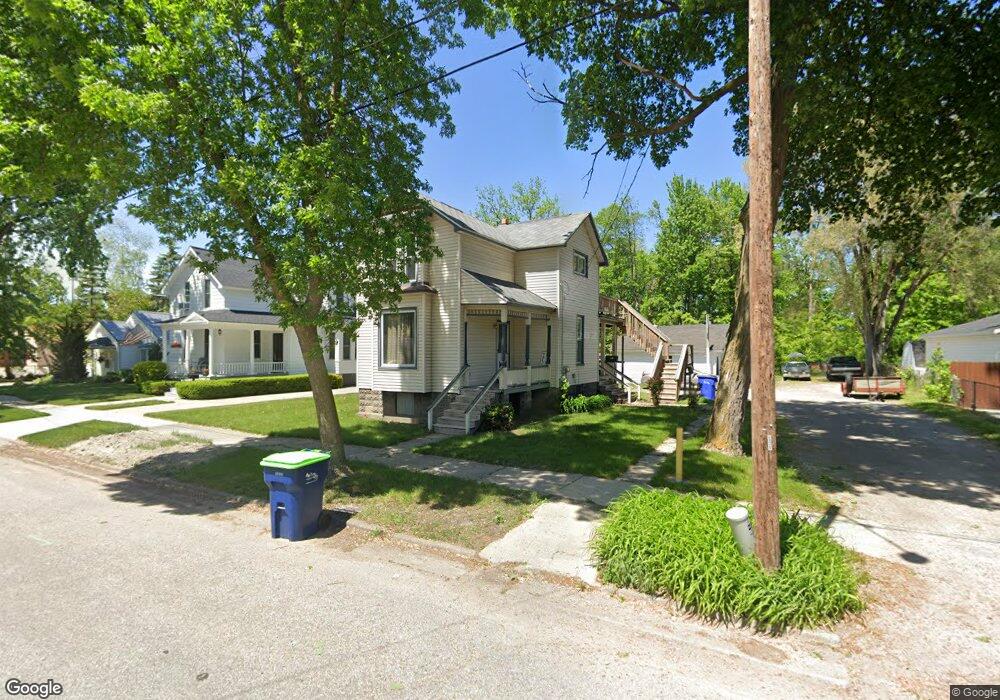
1825 2nd St Bay City, MI 48708
Estimated Value: $102,079 - $153,000
3
Beds
4
Baths
1,919
Sq Ft
$66/Sq Ft
Est. Value
About This Home
This home is located at 1825 2nd St, Bay City, MI 48708 and is currently estimated at $126,270, approximately $65 per square foot. 1825 2nd St is a home located in Bay County with nearby schools including Washington Elementary School, Handy Middle School, and Bay City Central High School.
Ownership History
Date
Name
Owned For
Owner Type
Purchase Details
Closed on
Jun 18, 2020
Sold by
Prankienas Michael R
Bought by
Prankienas Dominic
Current Estimated Value
Home Financials for this Owner
Home Financials are based on the most recent Mortgage that was taken out on this home.
Original Mortgage
$85,000
Outstanding Balance
$75,346
Interest Rate
3.2%
Mortgage Type
VA
Estimated Equity
$50,924
Purchase Details
Closed on
Aug 21, 1995
Sold by
Prankienas Dominic Joyce Michael
Bought by
Prankienas Michael R
Create a Home Valuation Report for This Property
The Home Valuation Report is an in-depth analysis detailing your home's value as well as a comparison with similar homes in the area
Home Values in the Area
Average Home Value in this Area
Purchase History
| Date | Buyer | Sale Price | Title Company |
|---|---|---|---|
| Prankienas Dominic | $85,000 | None Available | |
| Prankienas Michael R | $50,000 | -- |
Source: Public Records
Mortgage History
| Date | Status | Borrower | Loan Amount |
|---|---|---|---|
| Open | Prankienas Dominic | $85,000 |
Source: Public Records
Tax History Compared to Growth
Tax History
| Year | Tax Paid | Tax Assessment Tax Assessment Total Assessment is a certain percentage of the fair market value that is determined by local assessors to be the total taxable value of land and additions on the property. | Land | Improvement |
|---|---|---|---|---|
| 2025 | $2,033 | $47,950 | $0 | $0 |
| 2024 | $1,445 | $39,950 | $0 | $0 |
| 2023 | $690 | $0 | $0 | $0 |
| 2022 | $1,721 | $34,000 | $0 | $0 |
| 2021 | $1,678 | $31,600 | $31,600 | $0 |
| 2020 | $1,776 | $27,900 | $27,900 | $0 |
| 2019 | $2,088 | $26,500 | $0 | $0 |
| 2018 | $2,064 | $25,550 | $0 | $0 |
| 2017 | $1,701 | $25,300 | $0 | $0 |
| 2016 | $1,985 | $28,600 | $0 | $28,600 |
| 2015 | $1,922 | $29,500 | $0 | $29,500 |
| 2014 | $1,922 | $27,000 | $0 | $27,000 |
Source: Public Records
Map
Nearby Homes