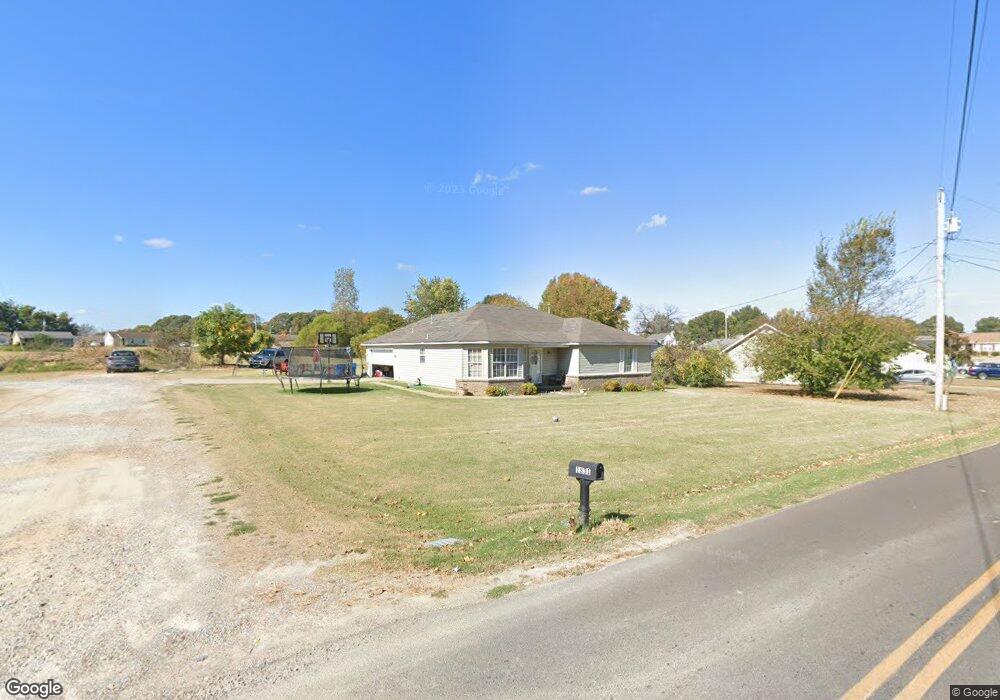
1831 Wooten St Covington, TN 38019
Estimated Value: $150,000 - $219,292
--
Bed
2
Baths
1,452
Sq Ft
$117/Sq Ft
Est. Value
About This Home
This home is located at 1831 Wooten St, Covington, TN 38019 and is currently estimated at $170,573, approximately $117 per square foot. 1831 Wooten St is a home located in Tipton County with nearby schools including Crestview Elementary School, Crestview Middle School, and Covington High School.
Ownership History
Date
Name
Owned For
Owner Type
Purchase Details
Closed on
Dec 30, 2004
Sold by
Hill Seleda M
Bought by
Autrell Williams
Current Estimated Value
Home Financials for this Owner
Home Financials are based on the most recent Mortgage that was taken out on this home.
Original Mortgage
$61,305
Interest Rate
5.71%
Purchase Details
Closed on
May 23, 2001
Bought by
Hill Seleda
Purchase Details
Closed on
Mar 26, 2001
Sold by
Wilson Trustee
Bought by
Brotherton Trust
Purchase Details
Closed on
Dec 14, 1998
Sold by
Jimmie Maclin
Bought by
Jimmie Maclin
Home Financials for this Owner
Home Financials are based on the most recent Mortgage that was taken out on this home.
Original Mortgage
$70,975
Interest Rate
6.94%
Purchase Details
Closed on
Sep 25, 1998
Bought by
Maclin Jimmie
Purchase Details
Closed on
Dec 31, 1996
Bought by
Brotherton Frank A & Martha M Revocable Trust
Create a Home Valuation Report for This Property
The Home Valuation Report is an in-depth analysis detailing your home's value as well as a comparison with similar homes in the area
Home Values in the Area
Average Home Value in this Area
Purchase History
| Date | Buyer | Sale Price | Title Company |
|---|---|---|---|
| Autrell Williams | $45,721 | -- | |
| Hill Seleda | $94,000 | -- | |
| Brotherton Trust | $48,301 | -- | |
| Jimmie Maclin | $70,975 | -- | |
| Maclin Jimmie | $71,000 | -- | |
| Brotherton Frank A & Martha M Revocable Trust | $11,100 | -- |
Source: Public Records
Mortgage History
| Date | Status | Borrower | Loan Amount |
|---|---|---|---|
| Closed | Brotherton Frank A & Martha M Revocable Trust | $61,305 | |
| Previous Owner | Brotherton Frank A & Martha M Revocable Trust | $70,975 |
Source: Public Records
Tax History Compared to Growth
Tax History
| Year | Tax Paid | Tax Assessment Tax Assessment Total Assessment is a certain percentage of the fair market value that is determined by local assessors to be the total taxable value of land and additions on the property. | Land | Improvement |
|---|---|---|---|---|
| 2024 | $1,009 | $39,800 | $3,750 | $36,050 |
| 2023 | $1,009 | $39,800 | $3,750 | $36,050 |
| 2022 | $912 | $27,800 | $2,750 | $25,050 |
| 2021 | $912 | $27,800 | $2,750 | $25,050 |
| 2020 | $912 | $27,800 | $2,750 | $25,050 |
| 2019 | $981 | $26,150 | $2,750 | $23,400 |
| 2018 | $981 | $26,150 | $2,750 | $23,400 |
| 2017 | $981 | $26,150 | $2,750 | $23,400 |
| 2016 | $981 | $26,150 | $2,750 | $23,400 |
| 2015 | $980 | $26,150 | $2,750 | $23,400 |
| 2014 | $980 | $26,146 | $0 | $0 |
Source: Public Records
Map
Nearby Homes
- 1517 Michael St
- 0 U S 51 S
- 0 Hwy 51
- 1186 U S 51
- 1728 Oil Mill Rd
- LOT 2 Oil Mill Rd
- 845 Antioch Hwy 51 Rd
- 004 Oil Mill Rd
- 1 Oil Mill Rd
- 000 Davis St
- 900 Peete St
- 902 Hatchie Ave
- 117 E Ripley Ave
- 325 Baxter Ave Unit 327
- 320 N Maple St
- 2051 Solo Rd
- 406 E Pleasant Ave
- 212 S Tipton St
- 107 W Pleasant Ave
- 0 N Munford St Unit 10156264