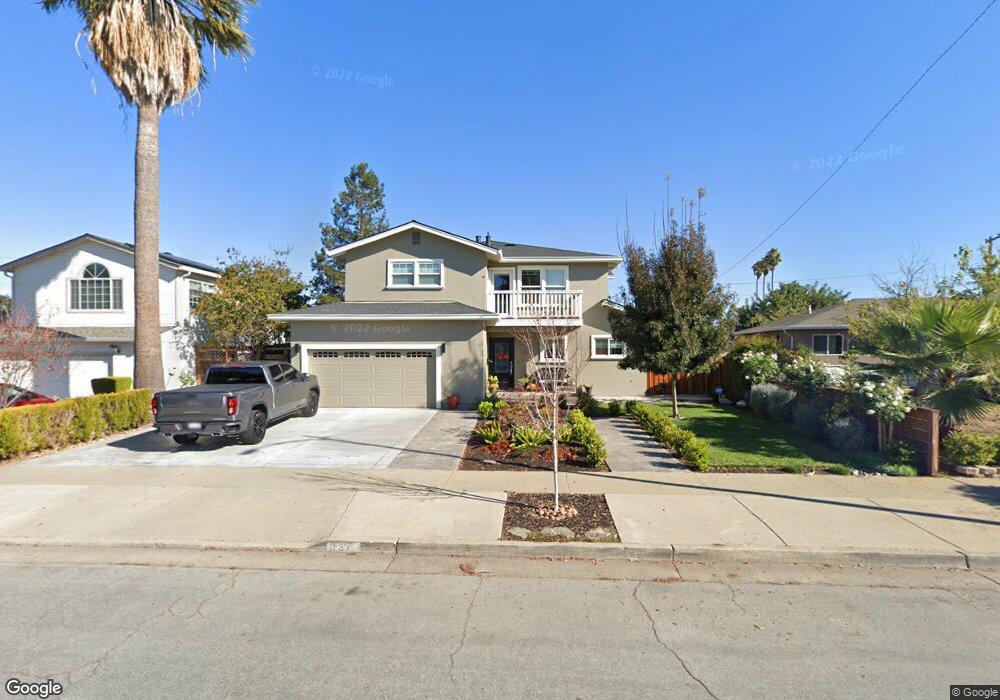
1837 Andrews Ave San Jose, CA 95124
Cambrian NeighborhoodEstimated Value: $2,038,000 - $2,610,000
5
Beds
3
Baths
2,667
Sq Ft
$909/Sq Ft
Est. Value
About This Home
This home is located at 1837 Andrews Ave, San Jose, CA 95124 and is currently estimated at $2,425,243, approximately $909 per square foot. 1837 Andrews Ave is a home located in Santa Clara County with nearby schools including Leigh High School, Sartorette Charter School, and Fammatre Elementary School.
Ownership History
Date
Name
Owned For
Owner Type
Purchase Details
Closed on
Aug 4, 2023
Sold by
Milazzo John Joseph and Milazzo Rita Robledo
Bought by
Milazzo Family Trust and Milazzo
Current Estimated Value
Home Financials for this Owner
Home Financials are based on the most recent Mortgage that was taken out on this home.
Original Mortgage
$275,000
Outstanding Balance
$260,373
Interest Rate
6.71%
Mortgage Type
New Conventional
Estimated Equity
$2,164,870
Purchase Details
Closed on
Jun 13, 2020
Sold by
Milazzo John J and Milazzo Rita R
Bought by
Milazzo John Joseph and Milazzo Rita Robledo
Purchase Details
Closed on
Jun 20, 1994
Sold by
Vanzuiden Gordon J and Vanzuiden Michele H
Bought by
Milazzo John J and Milazzo Rita R
Home Financials for this Owner
Home Financials are based on the most recent Mortgage that was taken out on this home.
Original Mortgage
$179,550
Interest Rate
8.6%
Create a Home Valuation Report for This Property
The Home Valuation Report is an in-depth analysis detailing your home's value as well as a comparison with similar homes in the area
Home Values in the Area
Average Home Value in this Area
Purchase History
| Date | Buyer | Sale Price | Title Company |
|---|---|---|---|
| Milazzo Family Trust | -- | None Listed On Document | |
| Milazzo John Joseph | -- | None Listed On Document | |
| Milazzo John Joseph | -- | None Available | |
| Milazzo John J | -- | None Available | |
| Milazzo John J | $189,000 | First American Title |
Source: Public Records
Mortgage History
| Date | Status | Borrower | Loan Amount |
|---|---|---|---|
| Open | Milazzo John Joseph | $275,000 | |
| Previous Owner | Milazzo John J | $179,550 |
Source: Public Records
Tax History Compared to Growth
Tax History
| Year | Tax Paid | Tax Assessment Tax Assessment Total Assessment is a certain percentage of the fair market value that is determined by local assessors to be the total taxable value of land and additions on the property. | Land | Improvement |
|---|---|---|---|---|
| 2025 | $9,846 | $685,346 | $135,956 | $549,390 |
| 2024 | $9,846 | $671,909 | $133,291 | $538,618 |
| 2023 | $9,736 | $658,735 | $130,678 | $528,057 |
| 2022 | $9,640 | $645,819 | $128,116 | $517,703 |
| 2021 | $9,426 | $633,156 | $125,604 | $507,552 |
| 2020 | $8,914 | $626,665 | $124,317 | $502,348 |
| 2019 | $8,790 | $614,379 | $121,880 | $492,499 |
| 2018 | $8,546 | $602,334 | $119,491 | $482,843 |
| 2017 | $8,363 | $590,525 | $117,149 | $473,376 |
| 2016 | $7,968 | $578,947 | $114,852 | $464,095 |
| 2015 | $7,870 | $570,251 | $113,127 | $457,124 |
| 2014 | $7,276 | $559,081 | $110,911 | $448,170 |
Source: Public Records
Map
Nearby Homes
- 1799 Bradford Way
- 1503 Love Ct
- 1800 Donna Ln
- 1886 Bernice Way
- 1505 Love Ct
- 1507 Love Ct
- 1502 Love Ct
- 1501 Paradise Ct
- 1500 Paradise Ct
- 1921 Camden Ave
- 3172 Kimber Ct Unit 84
- 3622 Kersten Dr
- 1756 Hallmark Ln
- 3429 New Jersey Ave
- 1944 Bernice Way
- 3942 Paladin Dr
- 4398 Camden Ave
- 3161 Quinto Way
- 1798 Barcelona Ave
- 1795 Foxworthy Ave
- 1833 Andrews Ave
- 1839 Andrews Ave
- 3741 Camden Ave
- 3763 Camden Ave
- 3761 Camden Ave
- 3717 Camden Ave
- 1831 Andrews Ave
- 1841 Andrews Ave
- 3787 Camden Ave
- 1838 Andrews Ave
- 3697 Camden Ave
- 1834 Andrews Ave
- 3809 Camden Ave
- 1840 Andrews Ave
- 1829 Andrews Ave
- 1832 Andrews Ave
- 1843 Andrews Ave
- 3677 Camden Ave
- 3831 Camden Ave
- 1830 Andrews Ave