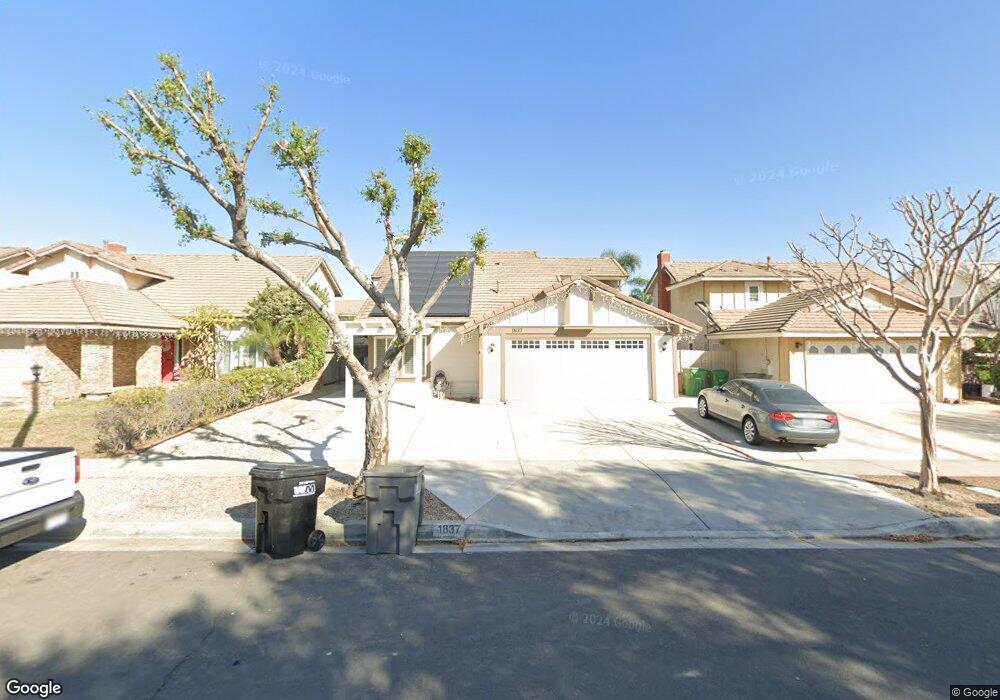
1837 Chesapeake Way Corona, CA 92880
North Corona NeighborhoodEstimated Value: $751,243 - $816,000
4
Beds
3
Baths
1,853
Sq Ft
$423/Sq Ft
Est. Value
About This Home
This home is located at 1837 Chesapeake Way, Corona, CA 92880 and is currently estimated at $784,061, approximately $423 per square foot. 1837 Chesapeake Way is a home located in Riverside County with nearby schools including George Washington Elementary, Auburndale Intermediate, and Norco High School.
Ownership History
Date
Name
Owned For
Owner Type
Purchase Details
Closed on
Aug 27, 2019
Sold by
Corral Celia Ofelia and Corral Ofelia C
Bought by
Corral Celia Ofelia and Corral Raymond A
Current Estimated Value
Home Financials for this Owner
Home Financials are based on the most recent Mortgage that was taken out on this home.
Original Mortgage
$120,000
Interest Rate
3.8%
Mortgage Type
New Conventional
Purchase Details
Closed on
Sep 5, 1996
Sold by
Corral Ofelia A and Corral Ofelia C
Bought by
Corral Ofelia C
Home Financials for this Owner
Home Financials are based on the most recent Mortgage that was taken out on this home.
Original Mortgage
$65,000
Interest Rate
8.23%
Mortgage Type
Purchase Money Mortgage
Create a Home Valuation Report for This Property
The Home Valuation Report is an in-depth analysis detailing your home's value as well as a comparison with similar homes in the area
Home Values in the Area
Average Home Value in this Area
Purchase History
| Date | Buyer | Sale Price | Title Company |
|---|---|---|---|
| Corral Celia Ofelia | -- | Fidelity National Title | |
| Corral Ofelia C | -- | Commonwealth Land Title Co |
Source: Public Records
Mortgage History
| Date | Status | Borrower | Loan Amount |
|---|---|---|---|
| Closed | Corral Celia Ofelia | $120,000 | |
| Closed | Corral Ofelia C | $65,000 |
Source: Public Records
Tax History Compared to Growth
Tax History
| Year | Tax Paid | Tax Assessment Tax Assessment Total Assessment is a certain percentage of the fair market value that is determined by local assessors to be the total taxable value of land and additions on the property. | Land | Improvement |
|---|---|---|---|---|
| 2025 | $3,551 | $317,222 | $104,001 | $213,221 |
| 2023 | $3,551 | $304,906 | $99,963 | $204,943 |
| 2022 | $3,440 | $298,928 | $98,003 | $200,925 |
| 2021 | $3,373 | $293,068 | $96,082 | $196,986 |
| 2020 | $3,337 | $290,064 | $95,097 | $194,967 |
| 2019 | $3,262 | $284,378 | $93,234 | $191,144 |
| 2018 | $3,190 | $278,803 | $91,406 | $187,397 |
| 2017 | $3,114 | $273,337 | $89,614 | $183,723 |
| 2016 | $3,083 | $267,978 | $87,857 | $180,121 |
| 2015 | $3,018 | $263,955 | $86,539 | $177,416 |
| 2014 | $2,913 | $258,787 | $84,845 | $173,942 |
Source: Public Records
Map
Nearby Homes
- 1841 Chesapeake Way
- 1826 Chesapeake Way
- 1868 Kingsford Dr
- 938 Amherst St
- 2151 Bowdoin St
- 921 Hedges Dr
- 2344 Santa Anita Rd
- 1142 Country Club Ln
- 4931 Roundup Rd
- 1530 Greenbriar Ave
- 2374 Corydon Ave
- 4921 Bluff St
- 1966 Trotter Trail
- 1474 Greenbriar Ave
- 911 Homestead Rd
- 936 Auburndale St
- 3344 Dales Dr
- 12866 Auburn Dr
- 12872 Auburn Dr
- 12868 Auburn Dr
- 1833 Chesapeake Way
- 1825 Chesapeake Way
- 1838 Providence Way
- 1847 Chesapeake Way
- 1842 Providence Way
- 1834 Providence Way
- 1848 Providence Way
- 1826 Providence Way
- 1821 Chesapeake Way
- 1855 Chesapeake Way
- 1838 Chesapeake Way
- 1834 Chesapeake Way
- 1842 Chesapeake Way
- 1822 Providence Way
- 1856 Providence Way
- 1848 Chesapeake Way
- 1817 Chesapeake Way
- 1859 Chesapeake Way
- 1822 Chesapeake Way
- 1816 Providence Way