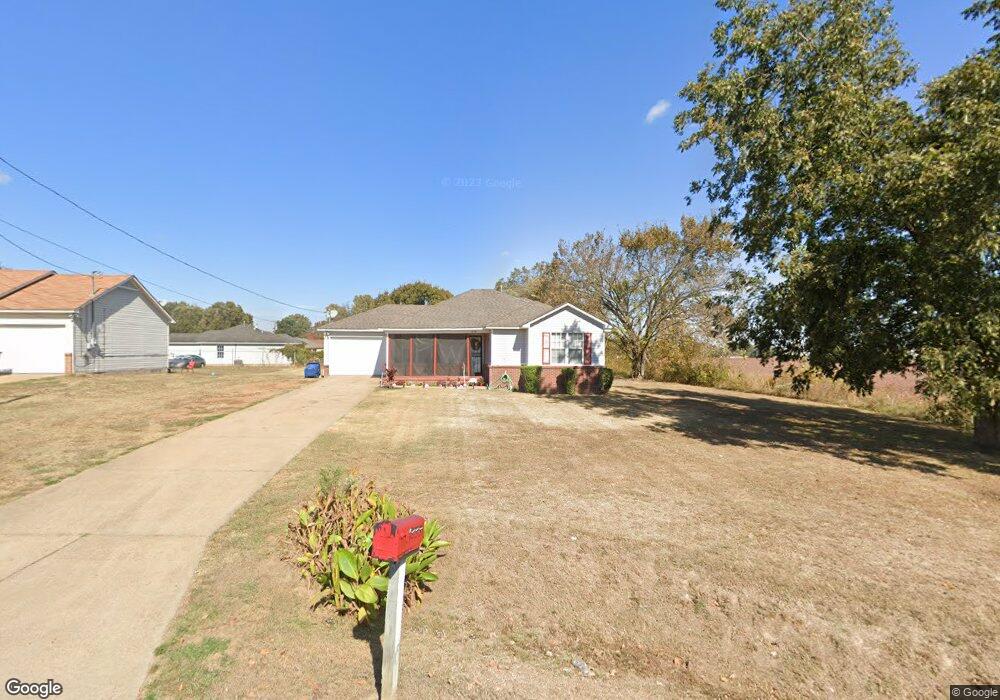
1838 Wooten St Covington, TN 38019
Estimated Value: $134,000 - $230,391
3
Beds
2
Baths
1,194
Sq Ft
$140/Sq Ft
Est. Value
About This Home
This home is located at 1838 Wooten St, Covington, TN 38019 and is currently estimated at $167,598, approximately $140 per square foot. 1838 Wooten St is a home located in Tipton County with nearby schools including Crestview Elementary School, Crestview Middle School, and Covington High School.
Ownership History
Date
Name
Owned For
Owner Type
Purchase Details
Closed on
Aug 15, 2008
Sold by
National City Bank
Bought by
Jan Hensley
Current Estimated Value
Purchase Details
Closed on
May 30, 2008
Sold by
Weiss Arnold M Sub & Tr
Bought by
National City Bank
Purchase Details
Closed on
Nov 30, 2005
Sold by
Bbn Properties Llc
Bought by
Ulas Craig
Home Financials for this Owner
Home Financials are based on the most recent Mortgage that was taken out on this home.
Original Mortgage
$67,600
Interest Rate
7.5%
Purchase Details
Closed on
Jun 22, 2005
Sold by
Houston Gordon J
Bought by
Bbn Properties Llc
Purchase Details
Closed on
Dec 11, 2002
Bought by
Houston Gordon
Purchase Details
Closed on
Aug 12, 2002
Sold by
Steve Singleton and Steve Sub
Bought by
Secretary Of Housing & Urb
Purchase Details
Closed on
Jul 27, 1998
Sold by
Oneal Tankersley
Bought by
Singleton Steve C
Purchase Details
Closed on
Mar 15, 1996
Bought by
Tankersley Oneal
Create a Home Valuation Report for This Property
The Home Valuation Report is an in-depth analysis detailing your home's value as well as a comparison with similar homes in the area
Home Values in the Area
Average Home Value in this Area
Purchase History
| Date | Buyer | Sale Price | Title Company |
|---|---|---|---|
| Jan Hensley | $42,500 | -- | |
| National City Bank | $72,640 | -- | |
| Ulas Craig | $84,500 | -- | |
| Bbn Properties Llc | -- | -- | |
| Houston Gordon | $60,000 | -- | |
| Secretary Of Housing & Urb | $79,802 | -- | |
| Singleton Steve C | $74,000 | -- | |
| Tankersley Oneal | $38,500 | -- |
Source: Public Records
Mortgage History
| Date | Status | Borrower | Loan Amount |
|---|---|---|---|
| Previous Owner | Tankersley Oneal | $67,600 | |
| Previous Owner | Tankersley Oneal | $16,900 |
Source: Public Records
Tax History Compared to Growth
Tax History
| Year | Tax Paid | Tax Assessment Tax Assessment Total Assessment is a certain percentage of the fair market value that is determined by local assessors to be the total taxable value of land and additions on the property. | Land | Improvement |
|---|---|---|---|---|
| 2024 | $781 | $30,825 | $3,750 | $27,075 |
| 2023 | $469 | $30,825 | $3,750 | $27,075 |
| 2022 | $708 | $21,550 | $2,750 | $18,800 |
| 2021 | $707 | $21,550 | $2,750 | $18,800 |
| 2020 | $707 | $21,550 | $2,750 | $18,800 |
| 2019 | $845 | $22,525 | $2,750 | $19,775 |
| 2018 | $845 | $22,525 | $2,750 | $19,775 |
| 2017 | $845 | $22,525 | $2,750 | $19,775 |
| 2016 | $845 | $22,525 | $2,750 | $19,775 |
| 2015 | $844 | $22,525 | $2,750 | $19,775 |
| 2014 | $844 | $22,514 | $0 | $0 |
Source: Public Records
Map
Nearby Homes
- 0 U S 51 S
- 1517 Michael St
- 0 Hwy 51
- 1186 U S 51
- 1728 Oil Mill Rd
- LOT 2 Oil Mill Rd
- 845 Antioch Hwy 51 Rd
- 004 Oil Mill Rd
- 1 Oil Mill Rd
- 000 Davis St
- 900 Peete St
- 902 Hatchie Ave
- 117 E Ripley Ave
- 325 Baxter Ave Unit 327
- 320 N Maple St
- 2051 Solo Rd
- 406 E Pleasant Ave
- 212 S Tipton St
- 107 W Pleasant Ave
- 0 N Munford St Unit 10156264
- 1840 Wooten St
- 1381 Sandpiper Dr
- 1842 Wooten St
- 1841 Wooten St
- 1387 Sandpiper Dr
- 1844 Wooten St
- 1839 Wooten St
- 1843 Wooten St
- 1380 Sandpiper Dr
- 1393 Sandpiper Dr
- 1846 Wooten St
- 1845 Wooten St
- 1837 Wooten St
- 1386 Sandpiper Dr
- 1830 Wooten St
- 1852 Wooten St
- 1435 Sandpiper Dr
- 1847 Wooten St
- 1392 Sandpiper Dr
- 1831 Wooten St