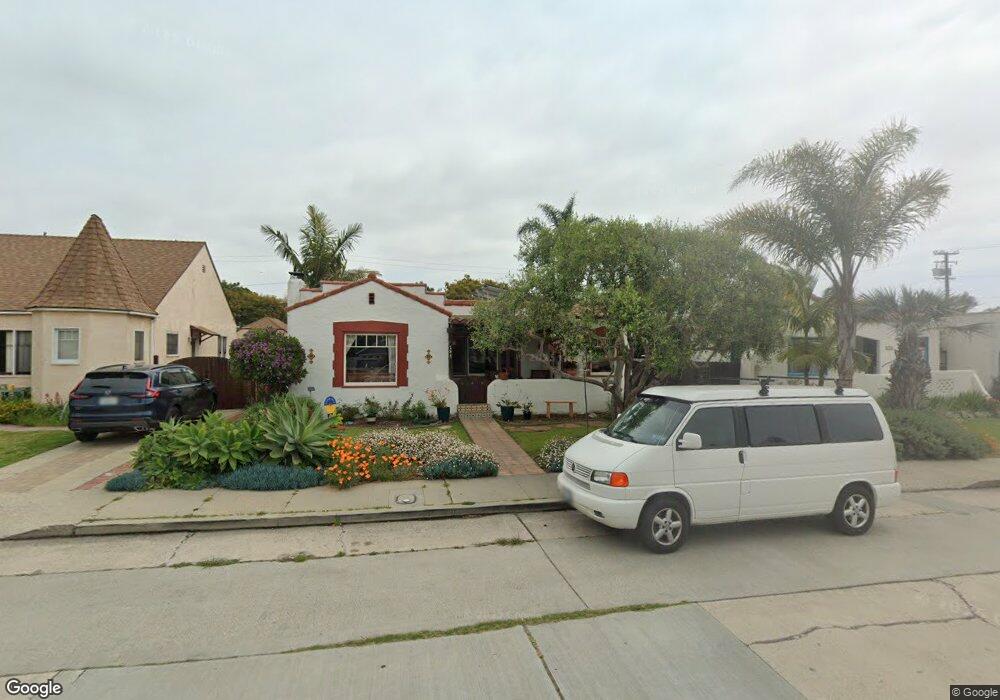
184 San Clemente St Ventura, CA 93001
Midtown NeighborhoodEstimated Value: $910,000 - $997,000
2
Beds
1
Bath
1,017
Sq Ft
$947/Sq Ft
Est. Value
About This Home
This home is located at 184 San Clemente St, Ventura, CA 93001 and is currently estimated at $963,045, approximately $946 per square foot. 184 San Clemente St is a home located in Ventura County with nearby schools including Will Rogers Elementary School, Cabrillo Middle School, and Ventura High School.
Ownership History
Date
Name
Owned For
Owner Type
Purchase Details
Closed on
Aug 19, 2016
Sold by
Lyons Mark
Bought by
Baushke Kathleen Ann
Current Estimated Value
Home Financials for this Owner
Home Financials are based on the most recent Mortgage that was taken out on this home.
Original Mortgage
$455,000
Outstanding Balance
$362,450
Interest Rate
3.43%
Mortgage Type
New Conventional
Estimated Equity
$600,595
Purchase Details
Closed on
Mar 13, 2013
Sold by
Lipscomb Lacey Rachelle
Bought by
Lyons Mark
Home Financials for this Owner
Home Financials are based on the most recent Mortgage that was taken out on this home.
Original Mortgage
$382,400
Interest Rate
3.53%
Mortgage Type
New Conventional
Purchase Details
Closed on
Feb 21, 2013
Sold by
King Kenneth and King Kiley
Bought by
Lyons Mark
Home Financials for this Owner
Home Financials are based on the most recent Mortgage that was taken out on this home.
Original Mortgage
$382,400
Interest Rate
3.53%
Mortgage Type
New Conventional
Purchase Details
Closed on
Apr 28, 2011
Sold by
King Kenneth and Grombacher Kiley
Bought by
King Kenneth and Grombacher Kiley
Home Financials for this Owner
Home Financials are based on the most recent Mortgage that was taken out on this home.
Original Mortgage
$368,000
Interest Rate
4.77%
Mortgage Type
New Conventional
Purchase Details
Closed on
Sep 9, 2008
Sold by
Coggins Michael Edward
Bought by
King Kenneth and Grombacher Kiley
Home Financials for this Owner
Home Financials are based on the most recent Mortgage that was taken out on this home.
Original Mortgage
$378,250
Interest Rate
6.39%
Mortgage Type
New Conventional
Purchase Details
Closed on
Jan 28, 2003
Sold by
Coggins Michael E
Bought by
Coggins Michael Edward
Home Financials for this Owner
Home Financials are based on the most recent Mortgage that was taken out on this home.
Original Mortgage
$64,000
Interest Rate
5.97%
Mortgage Type
Stand Alone Second
Purchase Details
Closed on
Feb 23, 1999
Sold by
Coggins Michael E
Bought by
The Michael Edward Coggins Sr Living Tr
Purchase Details
Closed on
Jul 2, 1996
Sold by
Mcneilly Colleen and Jahr Madeline
Bought by
Coggins Michael E
Home Financials for this Owner
Home Financials are based on the most recent Mortgage that was taken out on this home.
Original Mortgage
$106,400
Interest Rate
7.59%
Purchase Details
Closed on
Dec 15, 1995
Sold by
Berg Paul Doyle
Bought by
Berg Paul D
Create a Home Valuation Report for This Property
The Home Valuation Report is an in-depth analysis detailing your home's value as well as a comparison with similar homes in the area
Home Values in the Area
Average Home Value in this Area
Purchase History
| Date | Buyer | Sale Price | Title Company |
|---|---|---|---|
| Baushke Kathleen Ann | $625,000 | Fidelity National Title | |
| Lyons Mark | -- | Fidelity National Title Co | |
| Lyons Mark | $478,000 | Fidelity National Title Co | |
| King Kenneth | -- | Ticor Title Company Of Ca | |
| King Kenneth | $445,000 | First American Title Company | |
| Coggins Michael Edward | -- | Old Republic Title Ins Co | |
| The Michael Edward Coggins Sr Living Tr | -- | -- | |
| Coggins Michael E | $133,000 | United Title Company | |
| Berg Paul D | -- | -- |
Source: Public Records
Mortgage History
| Date | Status | Borrower | Loan Amount |
|---|---|---|---|
| Open | Baushke Kathleen Ann | $455,000 | |
| Previous Owner | Lyons Mark | $382,400 | |
| Previous Owner | King Kenneth | $368,000 | |
| Previous Owner | King Kenneth | $378,250 | |
| Previous Owner | Coggins Michael Edward | $64,000 | |
| Previous Owner | Coggins Michael E | $106,400 |
Source: Public Records
Tax History
| Year | Tax Paid | Tax Assessment Tax Assessment Total Assessment is a certain percentage of the fair market value that is determined by local assessors to be the total taxable value of land and additions on the property. | Land | Improvement |
|---|---|---|---|---|
| 2025 | $7,856 | $725,359 | $471,775 | $253,584 |
| 2024 | $7,856 | $711,137 | $462,525 | $248,612 |
| 2023 | $7,762 | $697,194 | $453,456 | $243,738 |
| 2022 | $7,227 | $683,524 | $444,565 | $238,959 |
| 2021 | $7,088 | $670,122 | $435,848 | $234,274 |
| 2020 | $7,021 | $663,253 | $431,380 | $231,873 |
| 2019 | $6,891 | $650,249 | $422,922 | $227,327 |
| 2018 | $6,776 | $637,500 | $414,630 | $222,870 |
| 2017 | $6,633 | $625,000 | $406,500 | $218,500 |
| 2016 | $5,299 | $497,227 | $374,482 | $122,745 |
| 2015 | $5,243 | $489,760 | $368,858 | $120,902 |
| 2014 | $5,157 | $480,169 | $361,634 | $118,535 |
Source: Public Records
Map
Nearby Homes
- 215 Coronado St
- 194 Jordan Ave
- 330 S Seaward Ave
- 1973 Evans Ave
- 2001 Alessandro Dr
- 2542 Poli St
- 268 N Linda Vista Ave
- 2324 Channel Dr Unit 105
- 2352 Channel Dr Unit 105
- 2352 Channel Dr Unit 101
- 1578 E Thompson Blvd
- 2378 Channel Dr Unit 105
- 1693 Poli St
- 1684 Poli St
- 2380 Haley Point Dr Unit 104
- 2392 Haley Point Dr Unit 104
- 1530 E Thompson Blvd
- 2222 Sunset Dr
- 2474 Fernwood Dr
- 2456 Sherwood Dr
- 194 San Clemente St
- 174 San Clemente St
- 204 San Clemente St
- 162 San Clemente St
- 214 San Clemente St
- 183 Coronado St
- 150 San Clemente St
- 195 Coronado St
- 161 Coronado St
- 187 Coronado St
- 205 Coronado St
- 159 Coronado St
- 185 San Clemente St
- 222 San Clemente St
- 195 San Clemente St
- 173 San Clemente St
- 2154 San Nicholas St
- 205 San Clemente St
- 151 Coronado St
- 161 San Clemente St
Your Personal Tour Guide
Ask me questions while you tour the home.