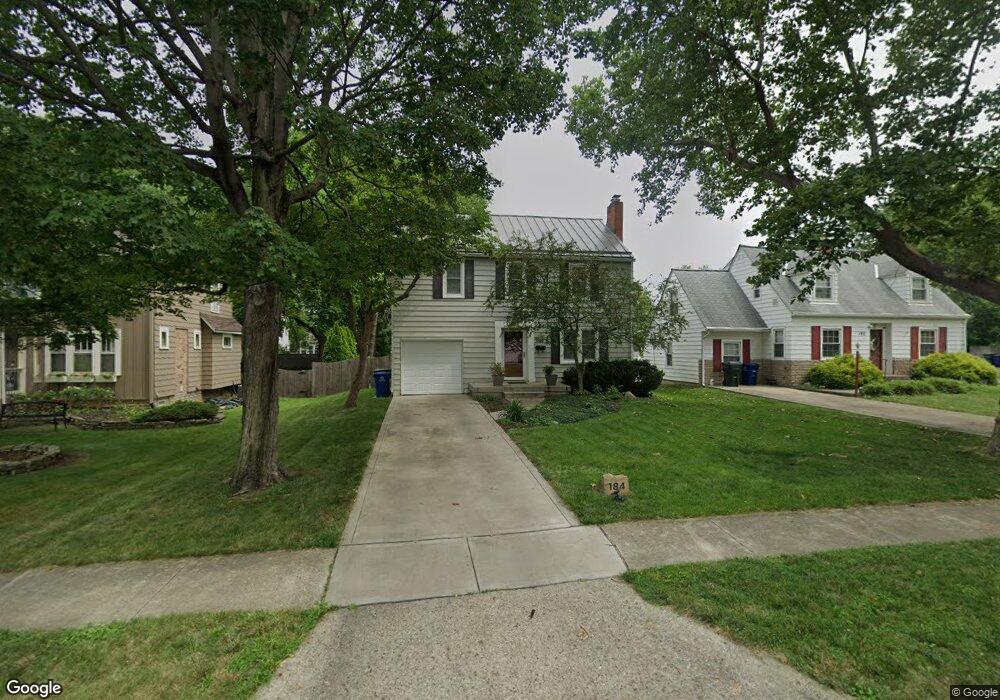
184 Wetmore Rd Columbus, OH 43214
Clintonville NeighborhoodEstimated Value: $368,000 - $413,000
3
Beds
1
Bath
1,296
Sq Ft
$308/Sq Ft
Est. Value
About This Home
This home is located at 184 Wetmore Rd, Columbus, OH 43214 and is currently estimated at $399,006, approximately $307 per square foot. 184 Wetmore Rd is a home located in Franklin County with nearby schools including Indian Springs Elementary School, Dominion Middle School, and Whetstone High School.
Ownership History
Date
Name
Owned For
Owner Type
Purchase Details
Closed on
Jul 13, 2015
Sold by
Pavkov Jonathan B and Pavkov Chelsea A
Bought by
Pepe Marieke C
Current Estimated Value
Purchase Details
Closed on
Dec 17, 2009
Sold by
Gallagher E Eugene and Gallagher Leota T
Bought by
Pavkov Jonathan D and Pavkov Chelsea A
Home Financials for this Owner
Home Financials are based on the most recent Mortgage that was taken out on this home.
Original Mortgage
$118,000
Outstanding Balance
$77,439
Interest Rate
5.02%
Mortgage Type
New Conventional
Estimated Equity
$321,567
Purchase Details
Closed on
Dec 30, 1986
Bought by
Gallagher Leota T
Create a Home Valuation Report for This Property
The Home Valuation Report is an in-depth analysis detailing your home's value as well as a comparison with similar homes in the area
Home Values in the Area
Average Home Value in this Area
Purchase History
| Date | Buyer | Sale Price | Title Company |
|---|---|---|---|
| Pepe Marieke C | $195,000 | None Available | |
| Pavkov Jonathan D | $147,500 | Talon Group | |
| Gallagher Leota T | -- | -- |
Source: Public Records
Mortgage History
| Date | Status | Borrower | Loan Amount |
|---|---|---|---|
| Open | Pavkov Jonathan D | $118,000 |
Source: Public Records
Tax History Compared to Growth
Tax History
| Year | Tax Paid | Tax Assessment Tax Assessment Total Assessment is a certain percentage of the fair market value that is determined by local assessors to be the total taxable value of land and additions on the property. | Land | Improvement |
|---|---|---|---|---|
| 2024 | $5,420 | $120,760 | $53,310 | $67,450 |
| 2023 | $5,350 | $120,750 | $53,305 | $67,445 |
| 2022 | $7,929 | $100,170 | $40,600 | $59,570 |
| 2021 | $5,205 | $100,170 | $40,600 | $59,570 |
| 2020 | $5,211 | $100,170 | $40,600 | $59,570 |
| 2019 | $4,644 | $76,550 | $31,220 | $45,330 |
| 2018 | $4,007 | $76,550 | $31,220 | $45,330 |
| 2017 | $4,641 | $76,550 | $31,220 | $45,330 |
| 2016 | $3,724 | $56,220 | $19,150 | $37,070 |
| 2015 | $3,381 | $56,220 | $19,150 | $37,070 |
| 2014 | $3,389 | $56,220 | $19,150 | $37,070 |
| 2013 | $1,592 | $53,550 | $18,235 | $35,315 |
Source: Public Records
Map
Nearby Homes
- 255 Garden Rd
- 156 E Weisheimer Rd
- 4 W Royal Forest Blvd
- 381 E Jeffrey Place
- 420 E Beechwold Blvd
- 224 Morse Rd
- 411 Garden Rd
- 116 Rathbone Ave
- 26 E Schreyer Place
- 518 E Royal Forest Blvd
- 522 E Beechwold Blvd
- 125 Sheffield Rd
- 202 Rathbone Ave
- 597 Morse Rd
- 601 Morse Rd
- 49 W Henderson Rd
- 4464 Zeller Rd
- 111 W Henderson Rd
- 197 E Cooke Rd
- 4299 Colerain Ave
- 178 Wetmore Rd
- 192 Wetmore Rd
- 170 Wetmore Rd
- 164 Wetmore Rd
- 206 Wetmore Rd
- 181 E Beechwold Blvd
- 177 E Beechwold Blvd
- 191 E Beechwold Blvd
- 171 E Beechwold Blvd
- 156 Wetmore Rd
- 212 Wetmore Rd
- 165 E Beechwold Blvd
- 205 E Beechwold Blvd
- 183 Wetmore Rd
- 189 Wetmore Rd
- 175 Wetmore Rd
- 169 Wetmore Rd
- 197 Wetmore Rd
- 150 Wetmore Rd
- 161 E Beechwold Blvd