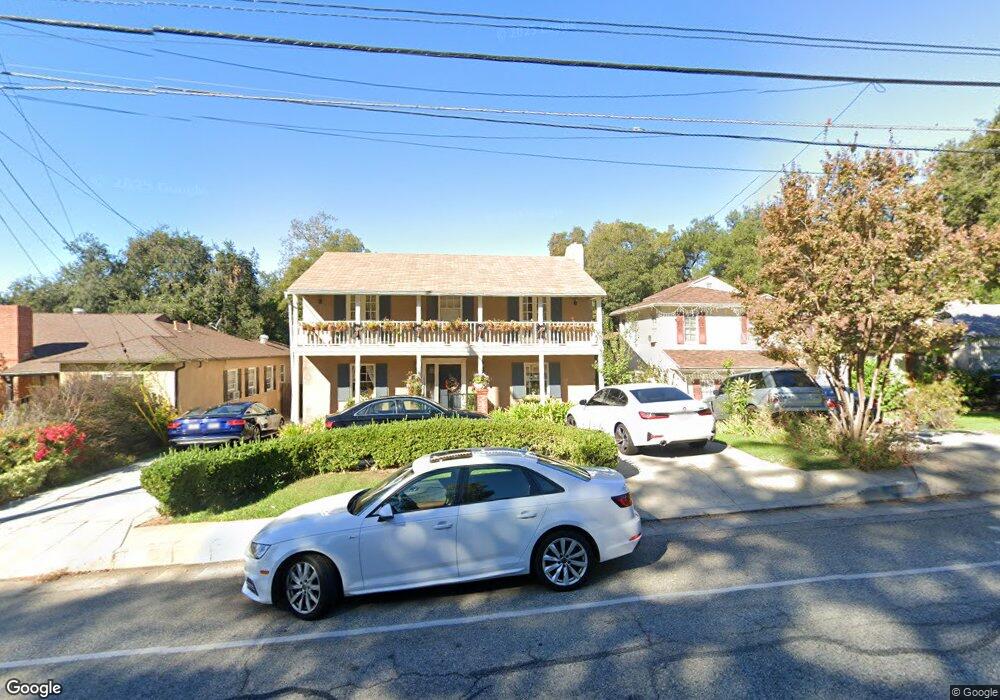
1841 N Verdugo Rd Glendale, CA 91208
Verdugo Woodlands NeighborhoodEstimated Value: $1,535,000 - $2,095,000
3
Beds
3
Baths
2,057
Sq Ft
$843/Sq Ft
Est. Value
About This Home
This home is located at 1841 N Verdugo Rd, Glendale, CA 91208 and is currently estimated at $1,733,624, approximately $842 per square foot. 1841 N Verdugo Rd is a home located in Los Angeles County with nearby schools including Verdugo Woodlands Elementary School, Woodrow Wilson Middle School, and Glendale High School.
Ownership History
Date
Name
Owned For
Owner Type
Purchase Details
Closed on
Sep 13, 2024
Sold by
Kalindjian Viken and Kalindjian Adrine R
Bought by
Kalindjian Family Trust and Kalindjian
Current Estimated Value
Purchase Details
Closed on
Jun 21, 2000
Sold by
Kalindjian Adrine R
Bought by
Kalindjian Viken and Kalindjian Adrine R
Home Financials for this Owner
Home Financials are based on the most recent Mortgage that was taken out on this home.
Original Mortgage
$297,000
Interest Rate
8.12%
Purchase Details
Closed on
Jul 8, 1999
Sold by
Kalindjian Viken Y
Bought by
Kalindjian Adrine R
Home Financials for this Owner
Home Financials are based on the most recent Mortgage that was taken out on this home.
Original Mortgage
$300,000
Interest Rate
8.5%
Purchase Details
Closed on
Jun 15, 1994
Sold by
Taormina Frank A
Bought by
Taormina Margaret D
Create a Home Valuation Report for This Property
The Home Valuation Report is an in-depth analysis detailing your home's value as well as a comparison with similar homes in the area
Home Values in the Area
Average Home Value in this Area
Purchase History
| Date | Buyer | Sale Price | Title Company |
|---|---|---|---|
| Kalindjian Family Trust | -- | None Listed On Document | |
| Kalindjian Viken | -- | First American Title Co | |
| Kalindjian Adrine R | -- | First American Title Co | |
| Kalindjian Adrine R | $334,000 | First American Title Co | |
| Taormina Margaret D | -- | -- |
Source: Public Records
Mortgage History
| Date | Status | Borrower | Loan Amount |
|---|---|---|---|
| Previous Owner | Kalindjian Viken | $297,000 | |
| Previous Owner | Kalindjian Adrine R | $300,000 |
Source: Public Records
Tax History Compared to Growth
Tax History
| Year | Tax Paid | Tax Assessment Tax Assessment Total Assessment is a certain percentage of the fair market value that is determined by local assessors to be the total taxable value of land and additions on the property. | Land | Improvement |
|---|---|---|---|---|
| 2025 | $5,709 | $513,323 | $376,547 | $136,776 |
| 2024 | $5,709 | $503,259 | $369,164 | $134,095 |
| 2023 | $5,582 | $493,392 | $361,926 | $131,466 |
| 2022 | $5,483 | $483,719 | $354,830 | $128,889 |
| 2021 | $5,383 | $474,235 | $347,873 | $126,362 |
| 2019 | $5,179 | $460,170 | $337,555 | $122,615 |
| 2018 | $5,014 | $451,148 | $330,937 | $120,211 |
| 2016 | $4,769 | $433,632 | $318,088 | $115,544 |
| 2015 | $4,672 | $427,120 | $313,311 | $113,809 |
| 2014 | $4,636 | $418,754 | $307,174 | $111,580 |
Source: Public Records
Map
Nearby Homes
- 1855 Verdugo Knolls Dr
- 1750 Wabasso Way
- 1637 N Verdugo Rd Unit A
- 1737 Opechee Way
- 1765 Fern Ln
- 1742 El Rito Ave
- 1659 Puebla Dr
- 1823 Risa Place
- 1438 Hillside Dr
- 2450 Hermosita Dr
- 1664 Las Flores Dr
- 1 Pasa Glen Dr
- 2 Emburns Dr
- 182 Emburns Dr
- 192 Emburns Dr
- 0 Pennerton Unit SB25222822
- 1535 Royal Blvd
- 1496 Belleau Rd
- 2 Pasa Glen Dr
- 925 Calle Del Pacifico
- 1843 N Verdugo Rd
- 1837 N Verdugo Rd
- 1847 N Verdugo Rd
- 1833 N Verdugo Rd
- 1827 N Verdugo Rd
- 1905 N Verdugo Rd
- 1844 N Verdugo Rd Unit B
- 1825 N Verdugo Rd
- 1909 N Verdugo Rd Unit A
- 1909 N Verdugo Rd
- 1830 N Verdugo Rd Unit 109
- 1838 N Verdugo Rd
- 1819 N Verdugo Rd Unit C
- 1819 N Verdugo Rd
- 1804 Tamerlane Dr Unit B
- 1804 Tamerlane Dr Unit D
- 1804 Tamerlane Dr Unit 1812
- 1806 Tamerlane Dr Unit D
- 1806 Tamerlane Dr Unit B
- 1806 Tamerlane Dr Unit A