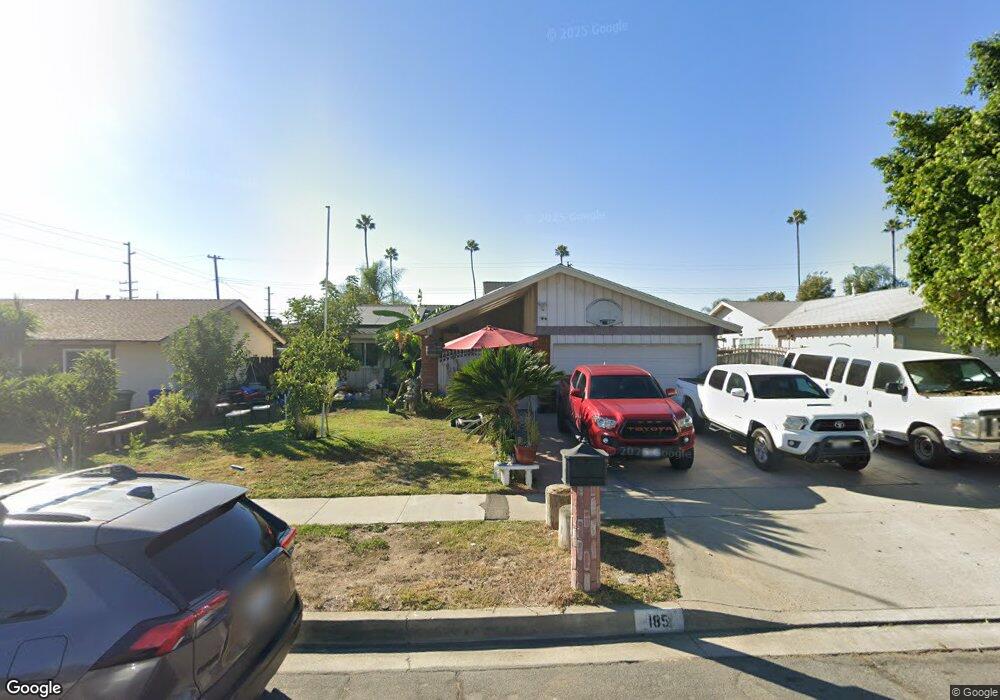
185 Grayson Way Upland, CA 91786
Estimated Value: $745,000 - $766,000
4
Beds
2
Baths
1,887
Sq Ft
$400/Sq Ft
Est. Value
About This Home
This home is located at 185 Grayson Way, Upland, CA 91786 and is currently estimated at $755,673, approximately $400 per square foot. 185 Grayson Way is a home located in San Bernardino County with nearby schools including Citrus Elementary, Upland Junior High School, and Upland High School.
Ownership History
Date
Name
Owned For
Owner Type
Purchase Details
Closed on
Jan 14, 2022
Sold by
Julieta Portillo
Bought by
Portillo Julieta and Cerezo Karla Giovana
Current Estimated Value
Home Financials for this Owner
Home Financials are based on the most recent Mortgage that was taken out on this home.
Original Mortgage
$396,000
Outstanding Balance
$365,486
Interest Rate
3.22%
Mortgage Type
New Conventional
Estimated Equity
$390,187
Purchase Details
Closed on
Jan 19, 2010
Sold by
Cerezo Carlos R and Cerezo Vicenta J
Bought by
Cerezo Vicenta J
Purchase Details
Closed on
Aug 25, 1994
Sold by
Desimone Betsy Riley and Riley Betsy
Bought by
Cerezo Carlos R and Cerezo Vicenta J
Home Financials for this Owner
Home Financials are based on the most recent Mortgage that was taken out on this home.
Original Mortgage
$144,000
Interest Rate
7.25%
Create a Home Valuation Report for This Property
The Home Valuation Report is an in-depth analysis detailing your home's value as well as a comparison with similar homes in the area
Home Values in the Area
Average Home Value in this Area
Purchase History
| Date | Buyer | Sale Price | Title Company |
|---|---|---|---|
| Portillo Julieta | -- | None Listed On Document | |
| Cerezo Vicenta J | -- | None Available | |
| Cerezo Carlos R | $160,000 | Continental Lawyers Title Co |
Source: Public Records
Mortgage History
| Date | Status | Borrower | Loan Amount |
|---|---|---|---|
| Open | Portillo Julieta | $396,000 | |
| Previous Owner | Cerezo Carlos R | $144,000 |
Source: Public Records
Tax History
| Year | Tax Paid | Tax Assessment Tax Assessment Total Assessment is a certain percentage of the fair market value that is determined by local assessors to be the total taxable value of land and additions on the property. | Land | Improvement |
|---|---|---|---|---|
| 2025 | $3,323 | $290,493 | $67,018 | $223,475 |
| 2024 | $3,218 | $284,797 | $65,704 | $219,093 |
| 2023 | $3,169 | $279,213 | $64,416 | $214,797 |
| 2022 | $3,026 | $273,738 | $63,153 | $210,585 |
| 2021 | $5,472 | $268,371 | $61,915 | $206,456 |
| 2020 | $5,389 | $265,619 | $61,280 | $204,339 |
| 2019 | $5,378 | $260,410 | $60,078 | $200,332 |
| 2018 | $5,307 | $255,304 | $58,900 | $196,404 |
| 2017 | $5,184 | $250,298 | $57,745 | $192,553 |
| 2016 | $4,961 | $245,390 | $56,613 | $188,777 |
| 2015 | $4,911 | $241,704 | $55,763 | $185,941 |
| 2014 | $2,452 | $236,970 | $54,671 | $182,299 |
Source: Public Records
Map
Nearby Homes
- 134 Coral Way
- 306 S Vallejo Way
- 126 Irving Way
- 1399 Fredericks Ln
- 595 Juniper Ave
- 1443 Fredericks Ln
- 633 Maple Way
- 428 W 8th St
- 1436 N Elderberry Ave
- 121 Genoa Way
- 435 W 9th St Unit B3
- 1549 N Oaks Ct
- 1446 N Gardenia Ave
- 617 N Ukiah Way
- 1496 Corte Hacienda Unit 1
- 1550 N Bonita Ct
- 814 W Bonnie Brae Ct
- 1553 Corte Santana
- 0 Bay St Unit AR25093919
- 333 White Ave
- 175 Grayson Way
- 193 Grayson Way
- 165 Grayson Way
- 182 Grayson Way
- 194 Grayson Way
- 172 Grayson Way
- 153 Grayson Way
- 162 Grayson Way
- 209 Grayson Way
- 143 Grayson Way
- 150 Grayson Way
- 181 Fulton Way
- 175 Fulton Way
- 204 Grayson Way Unit D
- 204 Grayson Way Unit Singh's Apartments
- 204 Grayson Way Unit C
- 204 Grayson Way
- 161 Fulton Way
- 221 Grayson Way Unit B
- 221 Grayson Way Unit C
Your Personal Tour Guide
Ask me questions while you tour the home.