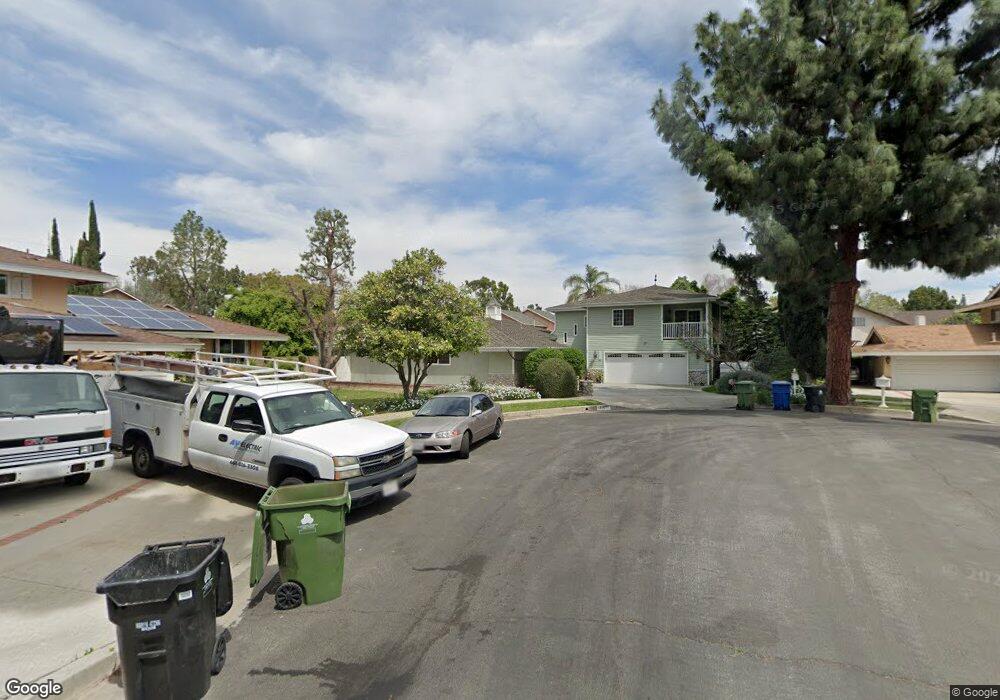
18601 Superior St Northridge, CA 91324
Estimated Value: $1,191,480 - $1,513,000
4
Beds
3
Baths
3,155
Sq Ft
$434/Sq Ft
Est. Value
About This Home
This home is located at 18601 Superior St, Northridge, CA 91324 and is currently estimated at $1,369,120, approximately $433 per square foot. 18601 Superior St is a home located in Los Angeles County with nearby schools including Northridge Academy High, Valley Academy of Arts & Sciences, and Topeka Charter School For Advanced Studies.
Ownership History
Date
Name
Owned For
Owner Type
Purchase Details
Closed on
Jan 10, 2012
Sold by
Bishop Francis J and Bishop Andrea M
Bought by
Bishop Francis J and Bishop Andrea M
Current Estimated Value
Home Financials for this Owner
Home Financials are based on the most recent Mortgage that was taken out on this home.
Original Mortgage
$403,000
Interest Rate
3.93%
Mortgage Type
New Conventional
Purchase Details
Closed on
Mar 25, 2011
Sold by
Bishop Francis J and Bishop Andrea M
Bought by
Bishop Francis J and Bishop Andrea M
Home Financials for this Owner
Home Financials are based on the most recent Mortgage that was taken out on this home.
Original Mortgage
$407,000
Interest Rate
4.9%
Mortgage Type
New Conventional
Purchase Details
Closed on
Oct 7, 1999
Sold by
Bishop Andrea and Bishop Francis J
Bought by
Bishop Francis J and Bishop Andrea M
Create a Home Valuation Report for This Property
The Home Valuation Report is an in-depth analysis detailing your home's value as well as a comparison with similar homes in the area
Home Values in the Area
Average Home Value in this Area
Purchase History
| Date | Buyer | Sale Price | Title Company |
|---|---|---|---|
| Bishop Francis J | -- | Accommodation | |
| Bishop Francis J | -- | Chicago Title Company | |
| Bishop Francis J | -- | None Available | |
| Bishop Francis J | -- | Chicago Title | |
| Bishop Francis J | -- | -- |
Source: Public Records
Mortgage History
| Date | Status | Borrower | Loan Amount |
|---|---|---|---|
| Closed | Bishop Francis J | $403,000 | |
| Closed | Bishop Francis J | $407,000 |
Source: Public Records
Tax History Compared to Growth
Tax History
| Year | Tax Paid | Tax Assessment Tax Assessment Total Assessment is a certain percentage of the fair market value that is determined by local assessors to be the total taxable value of land and additions on the property. | Land | Improvement |
|---|---|---|---|---|
| 2025 | $9,001 | $725,314 | $371,739 | $353,575 |
| 2024 | $9,001 | $711,093 | $364,450 | $346,643 |
| 2023 | $8,832 | $697,151 | $357,304 | $339,847 |
| 2022 | $8,431 | $683,483 | $350,299 | $333,184 |
| 2021 | $8,315 | $670,082 | $343,431 | $326,651 |
| 2019 | $8,071 | $650,209 | $333,246 | $316,963 |
| 2018 | $7,905 | $637,461 | $326,712 | $310,749 |
| 2016 | $7,532 | $612,709 | $314,026 | $298,683 |
| 2015 | $7,424 | $603,507 | $309,310 | $294,197 |
| 2014 | $7,451 | $591,687 | $303,252 | $288,435 |
Source: Public Records
Map
Nearby Homes
- 9763 Reseda Blvd Unit 83
- 9625 Yolanda Ave
- 9506 Yolanda Ave
- 9854 Canby Ave
- 18839 Plummer St
- 18524 Mayall St Unit D
- 18526 Mayall St Unit L
- 10004 Reseda Blvd Unit D
- 9301 Darby Ave
- 18540 Prairie St
- 18645 Knapp St
- 10116 Viking Ave
- 18753 Mayall St
- 10126 Reseda Blvd Unit 121
- 10126 Reseda Blvd Unit 112
- 9251 Wystone Ave
- 18170 Andrea Cir N Unit 1
- 19200 Ballinger St
- 18729 Sunburst St
- 18131 Andrea Cir N Unit 4
- 18609 Superior St
- 9701 Amigo Ave
- 9707 Amigo Ave
- 9655 Amigo Ave
- 18566 Marilla St
- 18558 Marilla St
- 18600 Superior St
- 18617 Superior St
- 18574 Marilla St
- 18550 Marilla St
- 18610 Superior St
- 9647 Amigo Ave
- 18576 Marilla St
- 18618 Superior St
- 18625 Superior St
- 9639 Amigo Ave
- 18601 Citronia St
- 18578 Marilla St
- 18626 Superior St
- 18609 Citronia St