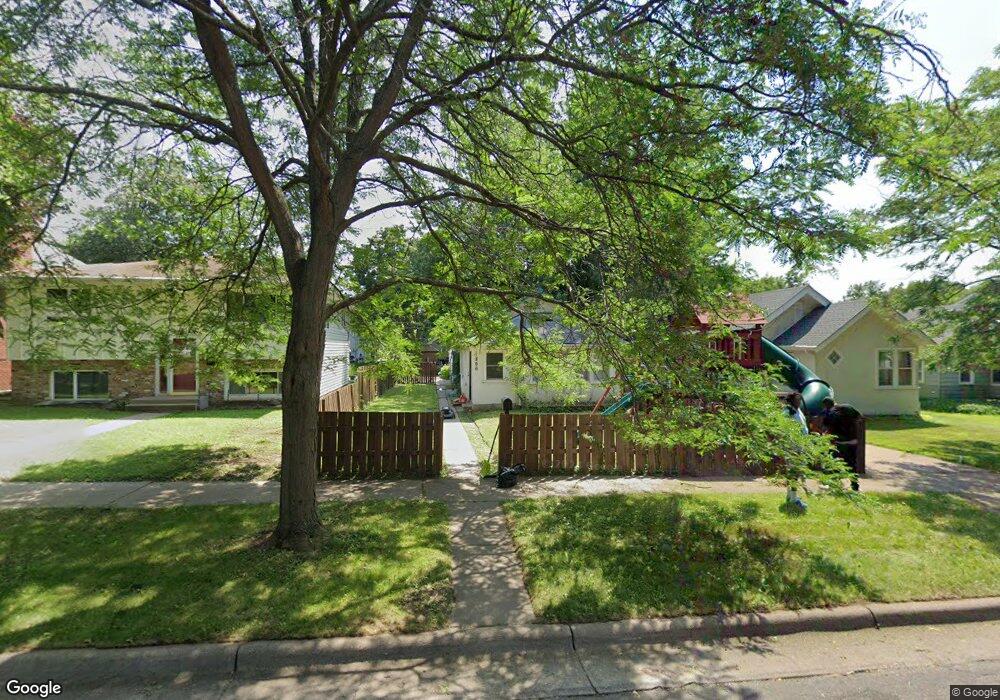
1866 Orange Ave E Saint Paul, MN 55119
Southern Hayden Heights NeighborhoodEstimated Value: $179,000 - $214,000
2
Beds
1
Bath
684
Sq Ft
$284/Sq Ft
Est. Value
About This Home
This home is located at 1866 Orange Ave E, Saint Paul, MN 55119 and is currently estimated at $194,279, approximately $284 per square foot. 1866 Orange Ave E is a home located in Ramsey County with nearby schools including The Heights Community School, Battle Creek Middle School, and Johnson Senior High School.
Ownership History
Date
Name
Owned For
Owner Type
Purchase Details
Closed on
May 11, 2020
Sold by
Cuevas Jessie M and Ceuvas Cinthia
Bought by
Grissom Jacquelynn Jeane
Current Estimated Value
Home Financials for this Owner
Home Financials are based on the most recent Mortgage that was taken out on this home.
Original Mortgage
$161,912
Outstanding Balance
$143,205
Interest Rate
3.2%
Mortgage Type
FHA
Estimated Equity
$51,074
Purchase Details
Closed on
May 23, 2014
Sold by
Barron Christopher J and Barron Laura M
Bought by
Cuevas Jessie M
Home Financials for this Owner
Home Financials are based on the most recent Mortgage that was taken out on this home.
Original Mortgage
$101,134
Interest Rate
4.34%
Mortgage Type
FHA
Purchase Details
Closed on
Sep 19, 2003
Sold by
Velasquez Henry and Velasquez Gloria M
Bought by
Barron Christopher J and Jung Laura M
Purchase Details
Closed on
Oct 3, 1996
Sold by
Patnaude Diane L
Bought by
Velasquez Henry N and Velasquez Gloria M
Create a Home Valuation Report for This Property
The Home Valuation Report is an in-depth analysis detailing your home's value as well as a comparison with similar homes in the area
Home Values in the Area
Average Home Value in this Area
Purchase History
| Date | Buyer | Sale Price | Title Company |
|---|---|---|---|
| Grissom Jacquelynn Jeane | $164,900 | Global Closing & Title Svcs | |
| Cuevas Jessie M | $106,121 | Home Title | |
| Barron Christopher J | $136,900 | -- | |
| Velasquez Henry N | $63,000 | -- |
Source: Public Records
Mortgage History
| Date | Status | Borrower | Loan Amount |
|---|---|---|---|
| Open | Grissom Jacquelynn Jeane | $161,912 | |
| Previous Owner | Cuevas Jessie M | $101,134 |
Source: Public Records
Tax History
| Year | Tax Paid | Tax Assessment Tax Assessment Total Assessment is a certain percentage of the fair market value that is determined by local assessors to be the total taxable value of land and additions on the property. | Land | Improvement |
|---|---|---|---|---|
| 2025 | $3,030 | $185,000 | $30,000 | $155,000 |
| 2024 | $3,030 | $195,900 | $30,000 | $165,900 |
| 2023 | $3,030 | $182,400 | $25,000 | $157,400 |
| 2022 | $2,710 | $207,000 | $25,000 | $182,000 |
| 2021 | $2,484 | $154,400 | $25,000 | $129,400 |
| 2020 | $2,566 | $155,400 | $19,400 | $136,000 |
| 2019 | $2,558 | $137,300 | $19,400 | $117,900 |
| 2018 | $2,164 | $134,800 | $19,400 | $115,400 |
| 2017 | $2,106 | $119,200 | $19,400 | $99,800 |
| 2016 | $1,540 | $0 | $0 | $0 |
| 2015 | $1,272 | $100,400 | $19,400 | $81,000 |
| 2014 | $1,148 | $0 | $0 | $0 |
Source: Public Records
Map
Nearby Homes
- 1779 Orange Ave E
- 1806 Maryland Ave E
- 1776 Maryland Ave E Unit 105
- 1728 Orange Ave E
- 1726 Hyacinth Ave E
- 1144 Flandrau St
- 1842 Arlington Ave E
- 2003 Cottage Ave E
- 1809 Mechanic Ave
- 1093 Breen St
- 1964 Arlington Ave E
- 1729 Sherwood Ave
- 1822 Nevada Ave E
- 1675 Clear Ave
- 1963 Arlington Ave E
- 1879 Ames Ave
- 1700 Sherwood Ave
- 1178 Herbert St
- 1862 Ames Ave
- 2112 Hawthorne Ave E
- 1866 1866 Orange-Avenue-e
- 1870 Orange Ave E
- 1870 1870 Orange-Avenue-e
- 1862 Orange Ave E
- 1874 Orange Ave E
- 1852 Orange Ave E
- 1852 1852 E Orange-Avenue-e
- 1878 Orange Ave E
- 1856 Orange Ave E
- 1865 Hawthorne Ave E
- 1867 Hawthorne Ave E
- 1859 Hawthorne Ave E
- 1882 Orange Ave E
- 1848 Orange Ave E
- 1873 Hawthorne Ave E
- 1861 Orange Ave E
- 1853 Hawthorne Ave E
- 1865 Orange Ave E
- 1861 1861 Orange-Avenue-e
- 1869 Orange Ave E
Your Personal Tour Guide
Ask me questions while you tour the home.