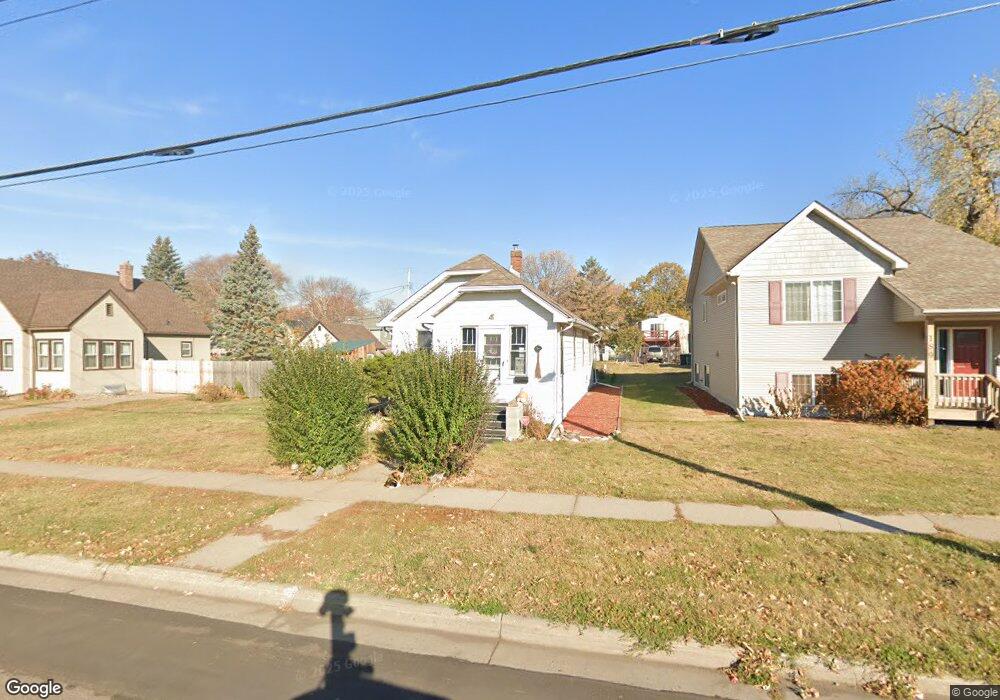
187 Haskell St E Saint Paul, MN 55118
Estimated Value: $240,424 - $282,000
2
Beds
1
Bath
716
Sq Ft
$360/Sq Ft
Est. Value
About This Home
This home is located at 187 Haskell St E, Saint Paul, MN 55118 and is currently estimated at $257,606, approximately $359 per square foot. 187 Haskell St E is a home located in Dakota County with nearby schools including Moreland Arts & Health Sciences Magnet School, Heritage E-STEM Magnet School, and Two Rivers High School.
Ownership History
Date
Name
Owned For
Owner Type
Purchase Details
Closed on
Jun 14, 2018
Sold by
Rausch Jesse and Brick Amber
Bought by
Kohlmeier Shane Leo
Current Estimated Value
Home Financials for this Owner
Home Financials are based on the most recent Mortgage that was taken out on this home.
Original Mortgage
$176,500
Outstanding Balance
$152,985
Interest Rate
4.6%
Mortgage Type
New Conventional
Estimated Equity
$104,621
Purchase Details
Closed on
Jan 22, 2018
Sold by
Schossow Phylis J
Bought by
Rausch Jesse
Purchase Details
Closed on
May 25, 2006
Sold by
K&L Home Construction Llc
Bought by
Schossow Phyllis
Home Financials for this Owner
Home Financials are based on the most recent Mortgage that was taken out on this home.
Original Mortgage
$119,500
Interest Rate
6.62%
Mortgage Type
New Conventional
Purchase Details
Closed on
Mar 20, 2006
Sold by
Reed Allen J and Rosenow Elizabeth A
Bought by
K & L Home Construction Llc
Create a Home Valuation Report for This Property
The Home Valuation Report is an in-depth analysis detailing your home's value as well as a comparison with similar homes in the area
Home Values in the Area
Average Home Value in this Area
Purchase History
| Date | Buyer | Sale Price | Title Company |
|---|---|---|---|
| Kohlmeier Shane Leo | $182,000 | Titlenexus Llc | |
| Rausch Jesse | $103,409 | Titlenexus Llc | |
| Schossow Phyllis | $134,900 | -- | |
| K & L Home Construction Llc | $145,000 | -- |
Source: Public Records
Mortgage History
| Date | Status | Borrower | Loan Amount |
|---|---|---|---|
| Open | Kohlmeier Shane Leo | $176,500 | |
| Previous Owner | Schossow Phyllis | $119,500 |
Source: Public Records
Tax History
| Year | Tax Paid | Tax Assessment Tax Assessment Total Assessment is a certain percentage of the fair market value that is determined by local assessors to be the total taxable value of land and additions on the property. | Land | Improvement |
|---|---|---|---|---|
| 2024 | $2,506 | $217,300 | $65,500 | $151,800 |
| 2023 | $2,506 | $217,400 | $69,400 | $148,000 |
| 2022 | $2,108 | $206,500 | $69,100 | $137,400 |
| 2021 | $1,908 | $178,700 | $60,100 | $118,600 |
| 2020 | $1,886 | $163,500 | $57,200 | $106,300 |
| 2019 | $1,732 | $157,900 | $54,500 | $103,400 |
| 2018 | $1,575 | $141,700 | $51,000 | $90,700 |
| 2017 | $1,400 | $135,900 | $48,600 | $87,300 |
| 2016 | $1,348 | $120,100 | $44,100 | $76,000 |
| 2015 | $1,255 | $89,963 | $31,067 | $58,896 |
| 2014 | -- | $80,698 | $27,894 | $52,804 |
| 2013 | -- | $79,935 | $25,654 | $54,281 |
Source: Public Records
Map
Nearby Homes
- 954 Oakdale Ave
- 181 Annapolis St E
- 235 Mainzer St
- 188 Wyoming St E
- 303 Haskell St E
- 268 Winona St E
- 84 Curtice St E
- 468 Curtice St E
- 246 Sidney St E
- 1096 Carrie St
- 302 Sidney St E
- 1076 Humboldt Ave
- 5 Belvidere St E
- 309 Sidney St E
- 38 Winona St W
- 778 Hall Ave
- 825 Kansas Ave
- 1116 Hall Ave
- 277 Morton St E
- 655 Robert St S
- 189 Haskell St E
- 181 Haskell St E
- 182 182 Haskell-Street-e
- 195 Haskell St E
- 197 Haskell St E
- 169 Haskell St E
- 197 Haskell St E
- 186 Hurley Ave E
- 192 192 Haskell-Street-e
- 184 Hurley Ave E
- 184 Hurley St E
- 172 Hurley Ave E
- 188 Hurley Ave E
- 176 Haskell St E
- 167 Haskell St E
- 188 Hurley St E
- 188 Haskell St E
- 170 Hurley Ave E
- 176 Haskell St E
- 182 Haskell St E
Your Personal Tour Guide
Ask me questions while you tour the home.