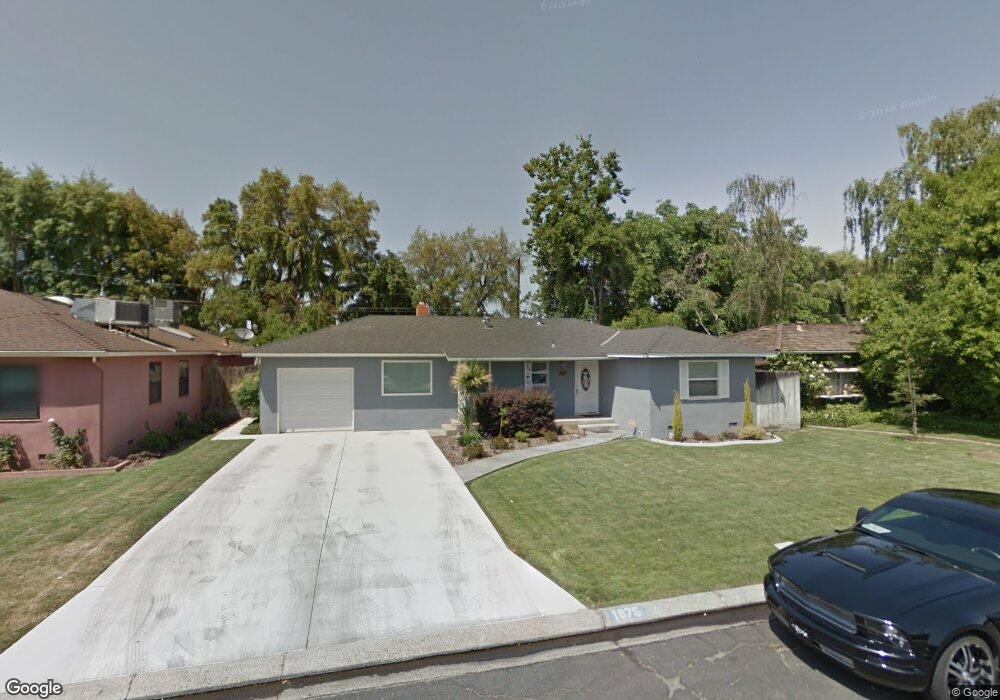
1875 Charles Place Turlock, CA 95380
Estimated Value: $339,000 - $455,000
2
Beds
2
Baths
1,305
Sq Ft
$300/Sq Ft
Est. Value
About This Home
This home is located at 1875 Charles Place, Turlock, CA 95380 and is currently estimated at $391,022, approximately $299 per square foot. 1875 Charles Place is a home located in Stanislaus County with nearby schools including Julien Elementary School, Marvin A. Dutcher Middle School, and Turlock Junior High School.
Ownership History
Date
Name
Owned For
Owner Type
Purchase Details
Closed on
Jul 10, 2015
Sold by
Jackson Gary L
Bought by
Jackson Gary L and Jackson Jenifer A
Current Estimated Value
Home Financials for this Owner
Home Financials are based on the most recent Mortgage that was taken out on this home.
Original Mortgage
$187,300
Interest Rate
3.86%
Mortgage Type
New Conventional
Purchase Details
Closed on
Dec 15, 2012
Sold by
Jackson Jennifer A
Bought by
Jackson Gary L
Home Financials for this Owner
Home Financials are based on the most recent Mortgage that was taken out on this home.
Original Mortgage
$140,200
Interest Rate
3.27%
Mortgage Type
New Conventional
Purchase Details
Closed on
Mar 1, 2000
Sold by
Jackson Donald E and Jackson Alice I
Bought by
Jackson Gary L
Purchase Details
Closed on
Jan 28, 2000
Sold by
Jackson Donald E and Jackson Alice I
Bought by
Jackson Gary L
Create a Home Valuation Report for This Property
The Home Valuation Report is an in-depth analysis detailing your home's value as well as a comparison with similar homes in the area
Home Values in the Area
Average Home Value in this Area
Purchase History
| Date | Buyer | Sale Price | Title Company |
|---|---|---|---|
| Jackson Gary L | -- | None Available | |
| Jackson Gary L | -- | None Available | |
| Jackson Gary L | -- | None Available | |
| Jackson Gary L | -- | -- | |
| Jackson Gary L | -- | -- |
Source: Public Records
Mortgage History
| Date | Status | Borrower | Loan Amount |
|---|---|---|---|
| Closed | Jackson Gary L | $187,300 | |
| Closed | Jackson Gary L | $140,200 |
Source: Public Records
Tax History Compared to Growth
Tax History
| Year | Tax Paid | Tax Assessment Tax Assessment Total Assessment is a certain percentage of the fair market value that is determined by local assessors to be the total taxable value of land and additions on the property. | Land | Improvement |
|---|---|---|---|---|
| 2025 | $585 | $61,156 | $13,916 | $47,240 |
| 2024 | $573 | $59,958 | $13,644 | $46,314 |
| 2023 | $571 | $58,783 | $13,377 | $45,406 |
| 2022 | $562 | $57,631 | $13,115 | $44,516 |
| 2021 | $552 | $56,502 | $12,858 | $43,644 |
| 2020 | $548 | $55,924 | $12,727 | $43,197 |
| 2019 | $537 | $54,828 | $12,478 | $42,350 |
| 2018 | $535 | $53,754 | $12,234 | $41,520 |
| 2017 | $521 | $52,701 | $11,995 | $40,706 |
| 2016 | $486 | $51,668 | $11,760 | $39,908 |
| 2015 | $479 | $50,893 | $11,584 | $39,309 |
| 2014 | $473 | $49,897 | $11,358 | $38,539 |
Source: Public Records
Map
Nearby Homes
- 1990 E Marshall St
- 820 N Berkeley Ave
- 1509 Sycamore St
- 2335 E Canal Dr
- 2500 E Marshall St
- 1409 E Marshall St
- 1598 East Ave
- 1400 Sycamore St
- 1311 Cahill Ave
- 658 Oak St
- 2521 East Ave
- 1015 E Main St
- 2676 Oppelt Way
- 951 E Main St
- 1370 East Ave
- 274 N Minaret Ave
- 1950 Simon Dr
- 1535 Niel Ave
- 1440 Sherwood Dr
- 716 N Daubenberger Rd
- 1855 Charles Place
- 1895 Charles Place
- 1835 Charles Place
- 1925 Charles Place
- 1876 Charles Place
- 1955 Charles Place
- 1856 Charles Place
- 1815 Charles Place
- 1900 Charles Place
- 1836 Charles Place
- 1930 Charles Place
- 1975 Charles Place
- 1816 Charles Place
- 1980 Charles Place
- 1995 Charles Place
- 1875 E Marshall St
- 1855 E Marshall St
- 1895 E Marshall St
- 1835 E Marshall St
- 1943 E Marshall St