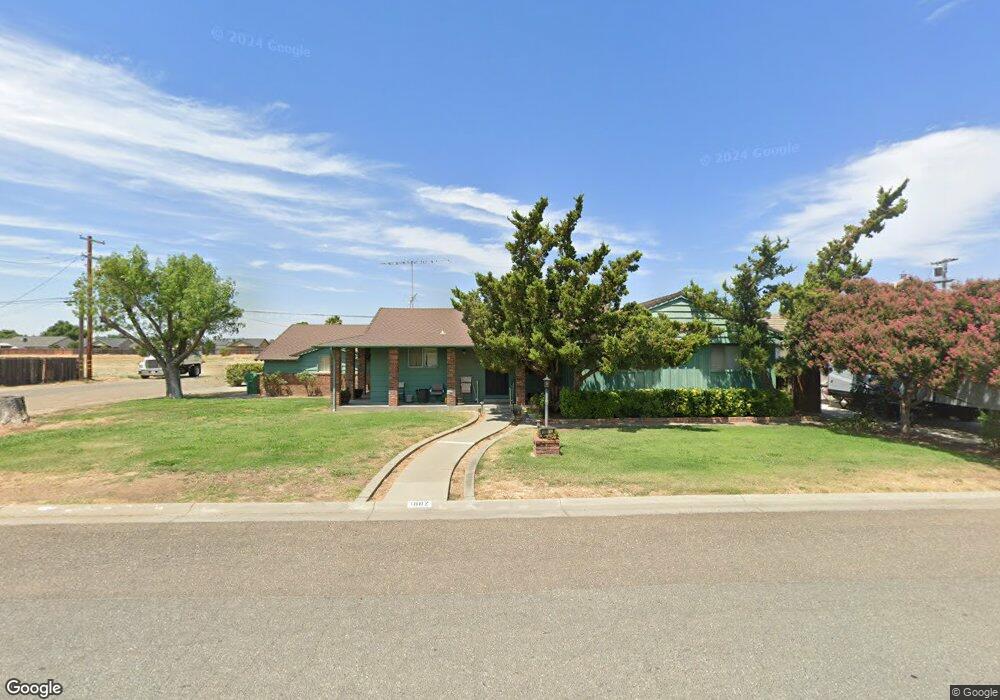
1882 Colusa St Corning, CA 96021
Estimated Value: $361,000 - $486,000
3
Beds
2
Baths
2,317
Sq Ft
$176/Sq Ft
Est. Value
About This Home
This home is located at 1882 Colusa St, Corning, CA 96021 and is currently estimated at $407,653, approximately $175 per square foot. 1882 Colusa St is a home located in Tehama County with nearby schools including Woodson Elementary School, Maywood Middle School, and Corning High School.
Ownership History
Date
Name
Owned For
Owner Type
Purchase Details
Closed on
Aug 7, 2014
Sold by
Schreindl Joseph and Schreindl Claudette
Bought by
Schreindl Family Revocable Trust
Current Estimated Value
Purchase Details
Closed on
Jul 22, 2014
Sold by
Schreindl Joseph and Schreindl Claudette
Bought by
Schreindl Joseph and Schreindl Claudette
Purchase Details
Closed on
Apr 8, 2014
Sold by
Turri Mary A
Bought by
Schreindl Joseph and Schreindl Claudette
Home Financials for this Owner
Home Financials are based on the most recent Mortgage that was taken out on this home.
Original Mortgage
$110,000
Outstanding Balance
$83,273
Interest Rate
4.23%
Mortgage Type
New Conventional
Estimated Equity
$324,380
Purchase Details
Closed on
May 17, 2010
Sold by
Turri Mary A
Bought by
Turri Mary A
Purchase Details
Closed on
Feb 2, 2010
Sold by
Turri W Anthony
Bought by
Turri Mary A
Purchase Details
Closed on
Oct 3, 2006
Sold by
Turri William R
Bought by
Turri William R
Create a Home Valuation Report for This Property
The Home Valuation Report is an in-depth analysis detailing your home's value as well as a comparison with similar homes in the area
Purchase History
| Date | Buyer | Sale Price | Title Company |
|---|---|---|---|
| Schreindl Family Revocable Trust | -- | None Available | |
| Schreindl Joseph | -- | None Available | |
| Schreindl Joseph | $180,000 | Northern California Title Co | |
| Turri Mary A | -- | None Available | |
| Turri Mary A | -- | None Available | |
| Turri William R | -- | None Available |
Source: Public Records
Mortgage History
| Date | Status | Borrower | Loan Amount |
|---|---|---|---|
| Open | Schreindl Joseph | $110,000 |
Source: Public Records
Tax History
| Year | Tax Paid | Tax Assessment Tax Assessment Total Assessment is a certain percentage of the fair market value that is determined by local assessors to be the total taxable value of land and additions on the property. | Land | Improvement |
|---|---|---|---|---|
| 2025 | $2,202 | $220,645 | $42,900 | $177,745 |
| 2023 | $2,159 | $212,079 | $41,235 | $170,844 |
| 2022 | $2,128 | $207,922 | $40,427 | $167,495 |
| 2021 | $2,046 | $203,846 | $39,635 | $164,211 |
| 2020 | $2,067 | $201,757 | $39,229 | $162,528 |
| 2019 | $1,981 | $197,802 | $38,460 | $159,342 |
| 2018 | $1,983 | $193,924 | $37,706 | $156,218 |
| 2017 | $1,968 | $190,122 | $36,967 | $153,155 |
| 2016 | $1,833 | $186,395 | $36,243 | $150,152 |
| 2015 | $1,822 | $183,596 | $35,699 | $147,897 |
| 2014 | $773 | $74,398 | $5,966 | $68,432 |
Source: Public Records
Map
Nearby Homes
- 1980 Colusa St
- 2097 North St
- 2480 Houghton Ave
- 1547 Blackburn Ave
- 4779 Houghton Ave
- 1419 Yolo St
- 233 Rio Verde Ct
- 311 6th St
- 243 Edith Ave
- 1013 Toomes Ave
- 1644 Kaufman Ave
- 2018 Donnovan Ave
- 1214 Marin St
- 1195 West St
- 1216 South St
- 1121 Marin St
- 0 Toomes Ave Unit SN25272183
- 0 Toomes Ave Unit SN24222817
- 0 Toomes Ave Unit SN25176211
- 2067 Blossom Ave
Your Personal Tour Guide
Ask me questions while you tour the home.