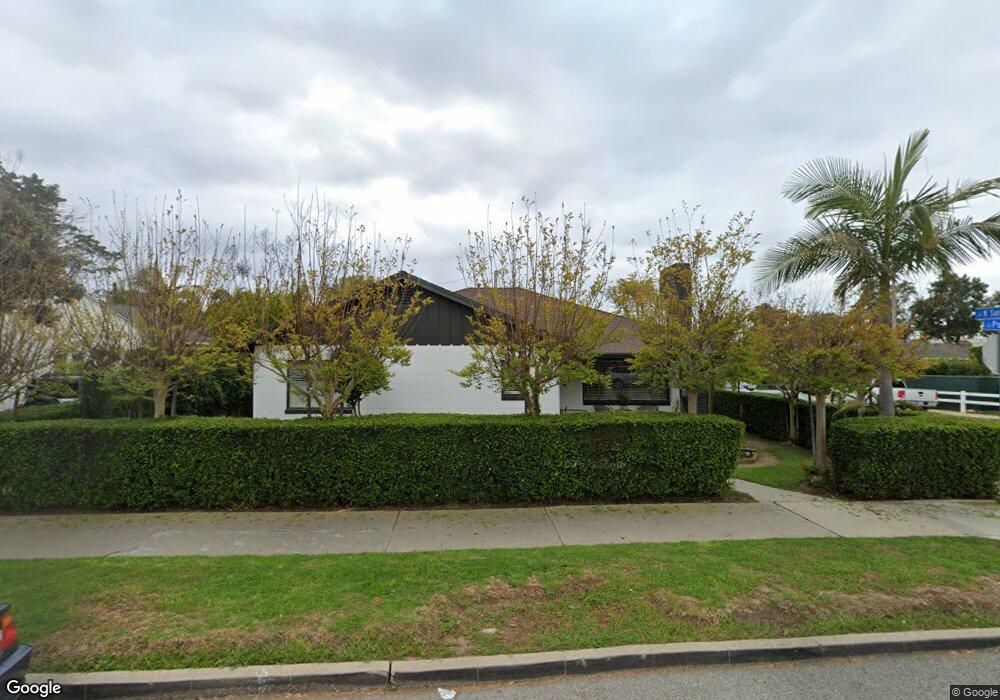
1882 Poli St Ventura, CA 93001
Midtown NeighborhoodEstimated Value: $1,012,000 - $1,309,000
2
Beds
2
Baths
1,628
Sq Ft
$718/Sq Ft
Est. Value
About This Home
This home is located at 1882 Poli St, Ventura, CA 93001 and is currently estimated at $1,169,595, approximately $718 per square foot. 1882 Poli St is a home located in Ventura County with nearby schools including Lincoln Elementary School, Cabrillo Middle School, and Ventura High School.
Ownership History
Date
Name
Owned For
Owner Type
Purchase Details
Closed on
Apr 9, 2019
Sold by
Edwards Nick
Bought by
Edwards Nick Russel and The Nick Russel Edwards Living
Current Estimated Value
Purchase Details
Closed on
Jan 19, 2006
Sold by
Edwards Nick Russell and Miller Hisae
Bought by
Edwards Nick and Miller Hisae
Home Financials for this Owner
Home Financials are based on the most recent Mortgage that was taken out on this home.
Original Mortgage
$50,000
Interest Rate
5.74%
Mortgage Type
New Conventional
Purchase Details
Closed on
Dec 20, 2004
Sold by
Simpson Larry S
Bought by
Edwards Nick Russell and Miller Hisae
Home Financials for this Owner
Home Financials are based on the most recent Mortgage that was taken out on this home.
Original Mortgage
$436,000
Outstanding Balance
$207,664
Interest Rate
5%
Mortgage Type
New Conventional
Estimated Equity
$961,931
Purchase Details
Closed on
Jan 24, 1997
Sold by
Simpson Dorothy A
Bought by
Simpson Dorothy A and Simpson Larry S
Create a Home Valuation Report for This Property
The Home Valuation Report is an in-depth analysis detailing your home's value as well as a comparison with similar homes in the area
Home Values in the Area
Average Home Value in this Area
Purchase History
| Date | Buyer | Sale Price | Title Company |
|---|---|---|---|
| Edwards Nick Russel | -- | None Available | |
| Edwards Nick | -- | Ticor | |
| Edwards Nick Russell | $545,000 | California Title Company | |
| Simpson Dorothy A | -- | -- |
Source: Public Records
Mortgage History
| Date | Status | Borrower | Loan Amount |
|---|---|---|---|
| Closed | Edwards Nick | $50,000 | |
| Open | Edwards Nick Russell | $436,000 | |
| Closed | Edwards Nick Russell | $54,500 |
Source: Public Records
Tax History Compared to Growth
Tax History
| Year | Tax Paid | Tax Assessment Tax Assessment Total Assessment is a certain percentage of the fair market value that is determined by local assessors to be the total taxable value of land and additions on the property. | Land | Improvement |
|---|---|---|---|---|
| 2025 | $8,039 | $742,378 | $549,282 | $193,096 |
| 2024 | $8,039 | $727,822 | $538,512 | $189,310 |
| 2023 | $7,942 | $713,551 | $527,952 | $185,599 |
| 2022 | $7,395 | $699,560 | $517,600 | $181,960 |
| 2021 | $7,253 | $685,844 | $507,451 | $178,393 |
| 2020 | $6,478 | $611,000 | $397,000 | $214,000 |
| 2019 | $7,212 | $681,004 | $562,300 | $118,704 |
| 2018 | $7,092 | $667,652 | $551,275 | $116,377 |
| 2017 | $6,943 | $654,562 | $540,466 | $114,096 |
| 2016 | $6,466 | $609,000 | $495,000 | $114,000 |
| 2015 | $4,974 | $464,000 | $377,000 | $87,000 |
| 2014 | $4,957 | $461,000 | $375,000 | $86,000 |
Source: Public Records
Map
Nearby Homes
- 258 N Linda Vista Ave
- 325 N Catalina St
- 44 Coronado St Unit 202
- 1871 Terrace Dr
- 66 San Clemente St
- Plan D at Portalvo - Townhomes
- Plan F at Portalvo - Townhomes
- Plan E at Portalvo - Townhomes
- Plan O at Portalvo - Condos/Flats
- Plan A at Portalvo - Townhomes
- Plan H at Portalvo - Condos/Flats
- Plan L at Portalvo - Condos/Flats
- Plan C at Portalvo - Townhomes
- Plan B at Portalvo - Townhomes
- Plan J at Portalvo - Condos/Flats
- Plan G at Portalvo - Townhomes
- Plan N at Portalvo - Condos/Flats
- Plan K at Portalvo - Condos/Flats
- Plan M at Portalvo - Condos/Flats
- 1806 Sunset Dr
- 1890 Poli St
- 94 N Santa Rosa St
- 1900 Poli St
- 107 N Santa Rosa St
- 84 N Santa Rosa St
- 1912 Poli St
- 97 N Santa Rosa St
- 1910 Poli St
- 85 N Santa Rosa St
- 74 N Santa Rosa St
- 1867 Poli St
- 1881 Poli St
- 95 N Santa Cruz St
- 1851 Poli St
- 1897 Poli St
- 83 N Santa Cruz St
- 1920 Poli St
- 1847 Poli St
- 75 N Santa Rosa St
- 1907 Poli St