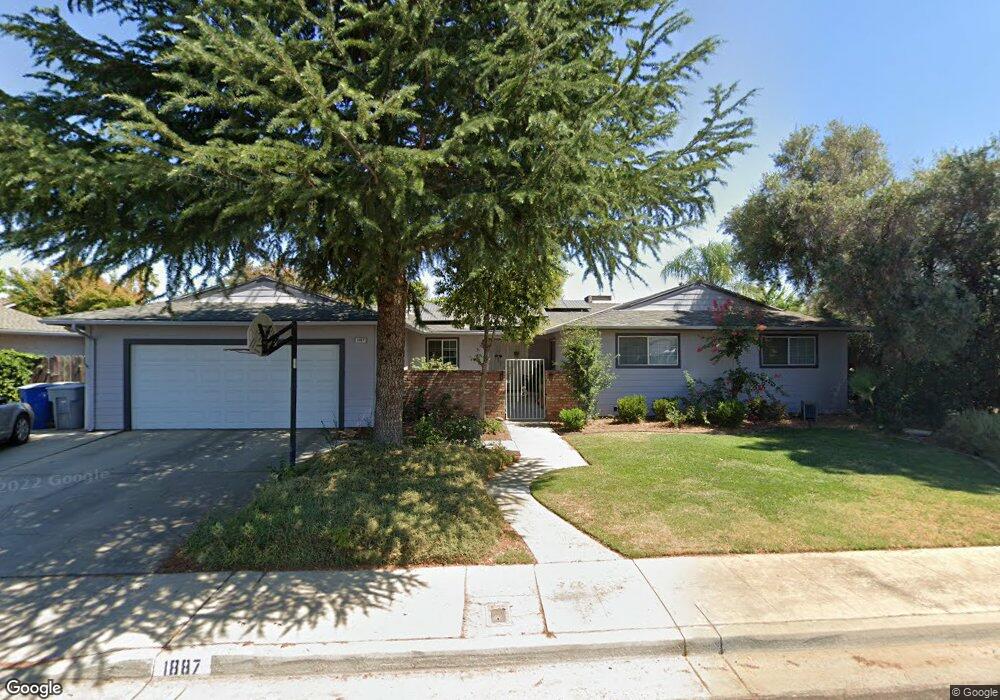
1887 Mitchell Ave Clovis, CA 93611
Estimated Value: $476,000 - $489,000
3
Beds
2
Baths
1,990
Sq Ft
$242/Sq Ft
Est. Value
About This Home
This home is located at 1887 Mitchell Ave, Clovis, CA 93611 and is currently estimated at $480,855, approximately $241 per square foot. 1887 Mitchell Ave is a home located in Fresno County with nearby schools including Clovis Elementary School, Clark Intermediate School, and Clovis High School.
Ownership History
Date
Name
Owned For
Owner Type
Purchase Details
Closed on
Mar 21, 2018
Sold by
Zemlicka Danny N and Zemlicka Vickie A
Bought by
Zemlicka Danny N and Zemlicka Vickie A
Current Estimated Value
Purchase Details
Closed on
May 10, 1999
Sold by
Betts Douglas E
Bought by
Zemlicka Danny N and Zemlicka Vickie A
Home Financials for this Owner
Home Financials are based on the most recent Mortgage that was taken out on this home.
Original Mortgage
$99,250
Interest Rate
7.05%
Purchase Details
Closed on
Jun 9, 1997
Sold by
Betts Evelyn R
Bought by
Betts Douglas E
Purchase Details
Closed on
Jun 2, 1994
Sold by
Farnsworth Bill D and Farnsworth Beverly
Bought by
Betts Douglas E and Betts Evelyn R
Home Financials for this Owner
Home Financials are based on the most recent Mortgage that was taken out on this home.
Original Mortgage
$140,156
Interest Rate
8.65%
Mortgage Type
FHA
Create a Home Valuation Report for This Property
The Home Valuation Report is an in-depth analysis detailing your home's value as well as a comparison with similar homes in the area
Home Values in the Area
Average Home Value in this Area
Purchase History
| Date | Buyer | Sale Price | Title Company |
|---|---|---|---|
| Zemlicka Danny N | -- | None Available | |
| Zemlicka Danny N | $144,500 | Fidelity National Title Co | |
| Betts Douglas E | -- | -- | |
| Betts Douglas E | $142,500 | Central Title Company |
Source: Public Records
Mortgage History
| Date | Status | Borrower | Loan Amount |
|---|---|---|---|
| Previous Owner | Zemlicka Danny N | $99,250 | |
| Previous Owner | Betts Douglas E | $140,156 |
Source: Public Records
Tax History
| Year | Tax Paid | Tax Assessment Tax Assessment Total Assessment is a certain percentage of the fair market value that is determined by local assessors to be the total taxable value of land and additions on the property. | Land | Improvement |
|---|---|---|---|---|
| 2025 | $2,591 | $225,728 | $70,537 | $155,191 |
| 2023 | $2,490 | $216,965 | $67,799 | $149,166 |
| 2022 | $2,456 | $212,712 | $66,470 | $146,242 |
| 2021 | $2,386 | $208,542 | $65,167 | $143,375 |
| 2020 | $2,376 | $206,404 | $64,499 | $141,905 |
| 2019 | $2,328 | $202,358 | $63,235 | $139,123 |
| 2018 | $2,276 | $198,392 | $61,996 | $136,396 |
| 2017 | $2,236 | $194,503 | $60,781 | $133,722 |
| 2016 | $2,158 | $190,690 | $59,590 | $131,100 |
| 2015 | $2,124 | $187,826 | $58,695 | $129,131 |
| 2014 | $2,084 | $184,148 | $57,546 | $126,602 |
Source: Public Records
Map
Nearby Homes
- 1876 Cougar Ln
- 1895 Dennis Ave
- 1584 Laverne Ave
- 1334 Shirley Ave
- 1721 Beverly Ave
- 1273 Bundy Ave
- 1622 Dennis Ave
- 1606 Barstow Ave
- 3497 Shaw Ave
- 860 Mcarthur Ave
- 2034 Wrenwood Ave
- 937 Filbert Ave
- 1515 Keats Ave
- 1428 Miami Ave
- 1946 Calimyrna Ave
- 2337 Wrenwood Ave
- 2518 Keats Ave
- 2468 Laverne Ave
- 2214 Fordham Ave
- 865 McKelvy Ave
- 1907 Mitchell Ave
- 1877 Mitchell Ave
- 1880 Cougar Ln
- 1922 Cougar Ln
- 1918 Cougar Ln
- 1886 Mitchell Ave
- 1927 Mitchell Ave
- 1867 Mitchell Ave
- 1876 Mitchell Ave
- 1872 Cougar Ln
- 1906 Mitchell Ave
- 1878 Cougar Ln
- 1914 Cougar Ln
- 1866 Mitchell Ave
- 1920 Cougar Ln
- 1874 Cougar Ln
- 1916 Cougar Ln
- 1947 Mitchell Ave
- 1857 Mitchell Ave
- 1870 Cougar Ln
Your Personal Tour Guide
Ask me questions while you tour the home.