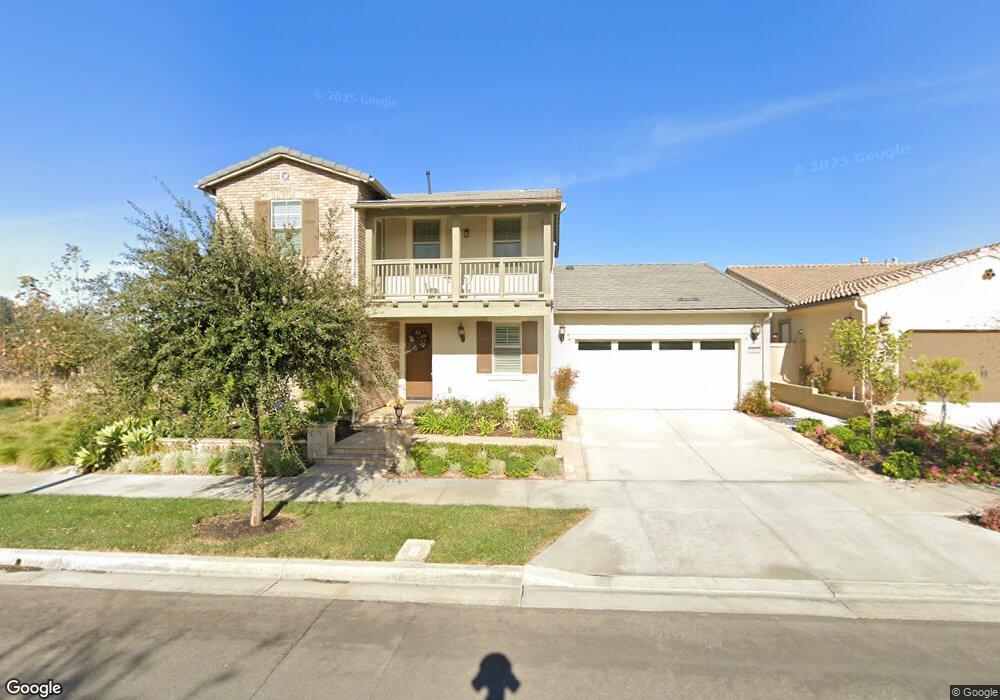
189 Salmon Irvine, CA 92618
Great Park NeighborhoodEstimated Value: $2,903,000 - $3,128,000
5
Beds
5
Baths
3,626
Sq Ft
$823/Sq Ft
Est. Value
About This Home
This home is located at 189 Salmon, Irvine, CA 92618 and is currently estimated at $2,984,269, approximately $823 per square foot. 189 Salmon is a home with nearby schools including Beacon Park, Portola High School, and Woodbury Elementary School.
Ownership History
Date
Name
Owned For
Owner Type
Purchase Details
Closed on
Jan 19, 2021
Sold by
Setya Ajay and Setya Archna
Bought by
Setya Family Living Trust and Setya
Current Estimated Value
Purchase Details
Closed on
Dec 27, 2018
Sold by
Ahn Sang Sun and Waid Fredrick
Bought by
Ahn Sang Sun and Ahn Sook
Purchase Details
Closed on
Oct 9, 2014
Sold by
Ahn Sang Sun and Ahn Sook Hyang
Bought by
Ahn Sang Sun and Ahn Sook Hyang
Purchase Details
Closed on
Jun 3, 2014
Sold by
Pulte Home Corporation
Bought by
Ahn Sang Sun and Ahn Sook Hyang
Home Financials for this Owner
Home Financials are based on the most recent Mortgage that was taken out on this home.
Original Mortgage
$484,753
Interest Rate
3.12%
Mortgage Type
New Conventional
Create a Home Valuation Report for This Property
The Home Valuation Report is an in-depth analysis detailing your home's value as well as a comparison with similar homes in the area
Home Values in the Area
Average Home Value in this Area
Purchase History
| Date | Buyer | Sale Price | Title Company |
|---|---|---|---|
| Setya Family Living Trust | -- | Accommodation/Courtesy Recordi | |
| Ahn Sang Sun | -- | None Available | |
| Ahn Sang Sun | $1,385,000 | None Available | |
| Ahn Sang Sun | $1,385,000 | First American Title Company |
Source: Public Records
Mortgage History
| Date | Status | Borrower | Loan Amount |
|---|---|---|---|
| Previous Owner | Ahn Sang Sun | $484,753 |
Source: Public Records
Tax History
| Year | Tax Paid | Tax Assessment Tax Assessment Total Assessment is a certain percentage of the fair market value that is determined by local assessors to be the total taxable value of land and additions on the property. | Land | Improvement |
|---|---|---|---|---|
| 2025 | $27,679 | $1,704,148 | $949,239 | $754,909 |
| 2024 | $27,679 | $1,670,734 | $930,627 | $740,107 |
| 2023 | $27,078 | $1,637,975 | $912,379 | $725,596 |
| 2022 | $26,546 | $1,605,858 | $894,489 | $711,369 |
| 2021 | $26,024 | $1,574,371 | $876,950 | $697,421 |
| 2020 | $25,810 | $1,558,228 | $867,958 | $690,270 |
| 2019 | $25,394 | $1,527,675 | $850,939 | $676,736 |
| 2018 | $24,895 | $1,497,721 | $834,254 | $663,467 |
| 2017 | $24,405 | $1,468,354 | $817,896 | $650,458 |
| 2016 | $23,925 | $1,439,563 | $801,859 | $637,704 |
| 2015 | $23,524 | $1,417,940 | $789,814 | $628,126 |
| 2014 | $14,512 | $554,295 | $554,295 | $0 |
Source: Public Records
Map
Nearby Homes
Your Personal Tour Guide
Ask me questions while you tour the home.