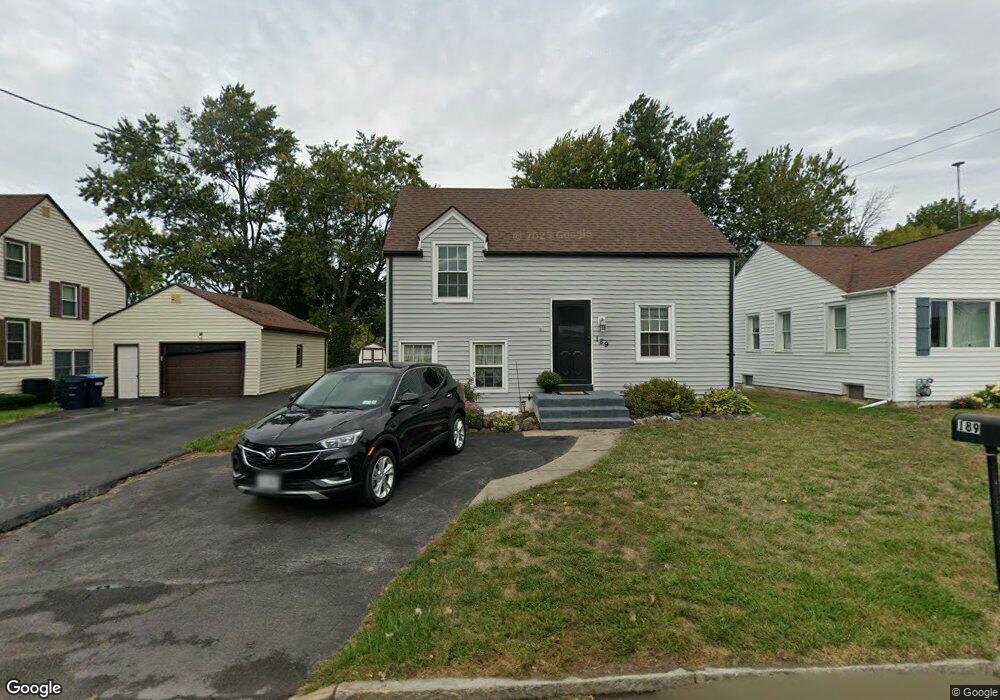
189 Vine St Batavia, NY 14020
Estimated Value: $123,000 - $183,000
3
Beds
1
Bath
924
Sq Ft
$160/Sq Ft
Est. Value
About This Home
This home is located at 189 Vine St, Batavia, NY 14020 and is currently estimated at $147,980, approximately $160 per square foot. 189 Vine St is a home located in Genesee County with nearby schools including Jackson Primary School, John Kennedy Intermediate School, and Batavia Middle School.
Ownership History
Date
Name
Owned For
Owner Type
Purchase Details
Closed on
Apr 15, 2019
Sold by
Stringham Melissa A and Elliott Melissa A
Bought by
Lovrdi Cheryl A
Current Estimated Value
Home Financials for this Owner
Home Financials are based on the most recent Mortgage that was taken out on this home.
Original Mortgage
$72,168
Outstanding Balance
$64,669
Interest Rate
5.5%
Mortgage Type
FHA
Estimated Equity
$83,311
Purchase Details
Closed on
Apr 1, 2003
Sold by
Mullins Douglas
Bought by
Elliott Melissa A
Purchase Details
Closed on
May 9, 1996
Sold by
Tock Mildred B
Bought by
Mullins Douglas and Mullins Cleo
Create a Home Valuation Report for This Property
The Home Valuation Report is an in-depth analysis detailing your home's value as well as a comparison with similar homes in the area
Home Values in the Area
Average Home Value in this Area
Purchase History
| Date | Buyer | Sale Price | Title Company |
|---|---|---|---|
| Lovrdi Cheryl A | $69,500 | -- | |
| Lovrdi Cheryl A | $69,500 | -- | |
| Elliott Melissa A | $59,900 | Thomas Williams | |
| Mullins Douglas | $46,500 | -- |
Source: Public Records
Mortgage History
| Date | Status | Borrower | Loan Amount |
|---|---|---|---|
| Open | Lovrdi Cheryl A | $72,168 | |
| Closed | Lovrdi Cheryl A | $72,168 |
Source: Public Records
Tax History
| Year | Tax Paid | Tax Assessment Tax Assessment Total Assessment is a certain percentage of the fair market value that is determined by local assessors to be the total taxable value of land and additions on the property. | Land | Improvement |
|---|---|---|---|---|
| 2024 | $3,272 | $101,000 | $16,800 | $84,200 |
| 2023 | $1,581 | $86,000 | $16,800 | $69,200 |
| 2022 | $3,040 | $86,000 | $16,800 | $69,200 |
| 2021 | $2,929 | $73,000 | $16,800 | $56,200 |
| 2020 | $2,853 | $72,000 | $16,800 | $55,200 |
| 2019 | $3,021 | $72,000 | $16,800 | $55,200 |
| 2018 | $3,021 | $72,000 | $16,800 | $55,200 |
| 2017 | $3,008 | $72,000 | $16,800 | $55,200 |
| 2016 | $3,018 | $70,000 | $16,800 | $53,200 |
| 2015 | -- | $70,000 | $16,800 | $53,200 |
| 2014 | -- | $70,000 | $16,800 | $53,200 |
Source: Public Records
Map
Nearby Homes
- 37 Vine St
- 126 State St
- 2 Mckinley Ave
- 0 Bank St Unit B1659421
- 11 Hall St
- 30 Prospect Ave
- 68 Oak St
- 8 S Main St
- 4 Otis St
- 0 Pearl & Wortendyke Rd Unit B1605288
- 4416 S Bennett Heights
- 8495 Stringham Dr
- 33 Pearl St
- 120 Hutchins St
- 53 Otis St
- 21 Briarwood Terrace
- 5070 Clinton Street Rd
- 5066 Clinton Street Rd
- 48 Redfield Pkwy
- 23 Adams St
Your Personal Tour Guide
Ask me questions while you tour the home.