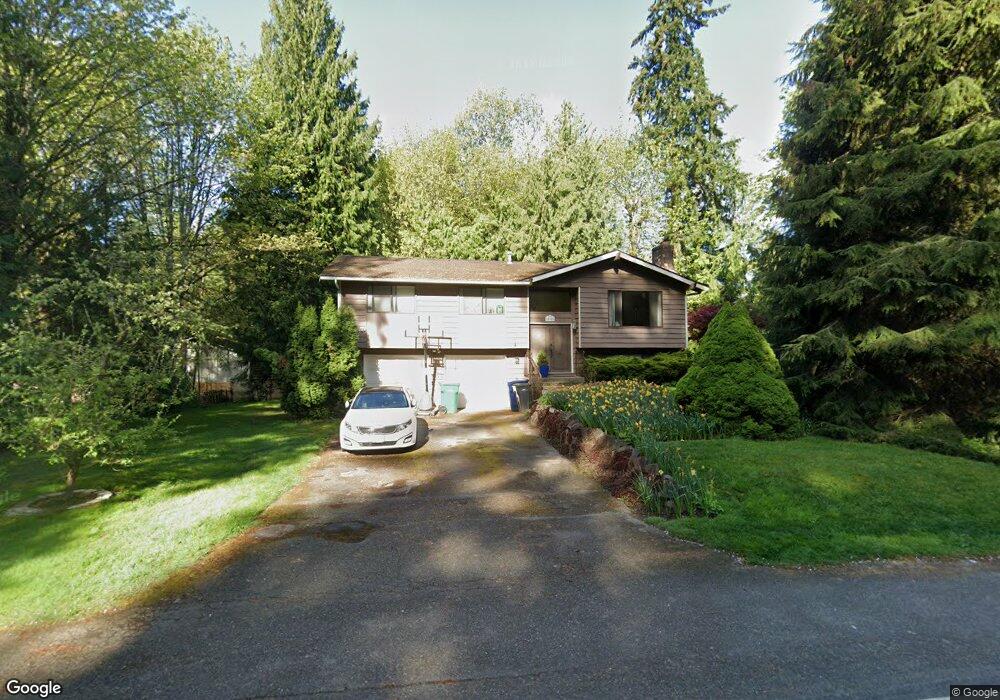
18908 25th Ave SE Bothell, WA 98012
North Creek NeighborhoodEstimated Value: $866,000 - $906,000
3
Beds
3
Baths
1,760
Sq Ft
$509/Sq Ft
Est. Value
About This Home
This home is located at 18908 25th Ave SE, Bothell, WA 98012 and is currently estimated at $895,229, approximately $508 per square foot. 18908 25th Ave SE is a home located in Snohomish County with nearby schools including Crystal Springs Elementary School, Skyview Middle School, and North Creek High School.
Ownership History
Date
Name
Owned For
Owner Type
Purchase Details
Closed on
Jan 20, 2021
Sold by
Andrew Gary Robert and Andrew Rachel Leann
Bought by
Andrew Gary Robert and Andrew Rachel Le
Current Estimated Value
Purchase Details
Closed on
Jun 30, 2011
Sold by
Perez Roland D and Perez Cheryl I
Bought by
Andrew Rachel L and Andrew Gary R
Home Financials for this Owner
Home Financials are based on the most recent Mortgage that was taken out on this home.
Original Mortgage
$243,450
Outstanding Balance
$163,739
Interest Rate
4.5%
Mortgage Type
New Conventional
Estimated Equity
$731,490
Purchase Details
Closed on
Jun 18, 1998
Sold by
Norman Russell B and Huston Trina J
Bought by
Perez Roland D and Perez Cheryl I
Home Financials for this Owner
Home Financials are based on the most recent Mortgage that was taken out on this home.
Original Mortgage
$170,950
Interest Rate
7.17%
Create a Home Valuation Report for This Property
The Home Valuation Report is an in-depth analysis detailing your home's value as well as a comparison with similar homes in the area
Home Values in the Area
Average Home Value in this Area
Purchase History
| Date | Buyer | Sale Price | Title Company |
|---|---|---|---|
| Andrew Gary Robert | -- | None Available | |
| Andrew Rachel L | $270,780 | Ticor Title | |
| Perez Roland D | $179,950 | Fidelity National Title |
Source: Public Records
Mortgage History
| Date | Status | Borrower | Loan Amount |
|---|---|---|---|
| Open | Andrew Rachel L | $243,450 | |
| Previous Owner | Perez Roland D | $170,950 |
Source: Public Records
Tax History
| Year | Tax Paid | Tax Assessment Tax Assessment Total Assessment is a certain percentage of the fair market value that is determined by local assessors to be the total taxable value of land and additions on the property. | Land | Improvement |
|---|---|---|---|---|
| 2026 | $7,897 | $962,700 | $715,000 | $247,700 |
| 2025 | $7,260 | $878,300 | $640,000 | $238,300 |
| 2024 | $7,260 | $807,200 | $577,000 | $230,200 |
| 2023 | $8,603 | $1,069,800 | $805,000 | $264,800 |
| 2022 | $7,533 | $744,200 | $520,000 | $224,200 |
| 2020 | $6,584 | $613,100 | $416,000 | $197,100 |
| 2019 | $5,831 | $548,700 | $358,000 | $190,700 |
| 2018 | $5,566 | $487,700 | $315,000 | $172,700 |
| 2017 | $4,715 | $419,800 | $260,000 | $159,800 |
| 2016 | $4,414 | $383,200 | $230,000 | $153,200 |
| 2015 | $4,284 | $353,100 | $215,000 | $138,100 |
| 2013 | $3,436 | $250,700 | $158,000 | $92,700 |
Source: Public Records
Map
Nearby Homes
- 18809 20th Dr SE
- 19218 26th Ave SE Unit 117
- 2401 185th Place SE
- 19102 20th Dr SE Unit B204
- 19102 20th Dr SE Unit B202
- 19102 20th Dr SE Unit B206
- 18632 29th Ave SE
- 3125 194th St SE
- 18501 28th Ave SE
- 18429 20th Dr SE
- 18309 26th Dr SE
- 2009 196th St SE Unit E303
- 2009 196th St SE Unit C303
- 2009 196th St SE Unit C103
- 18930 Bothell Everett Hwy Unit B-103
- 18930 Bothell Everett Hwy Unit G103
- 18930 Bothell Everett Hwy Unit G105
- 18910 Bothell Everett Hwy Unit H2
- 18910 Bothell Everett Hwy Unit N2
- 19520 Grannis Rd
- 2418 188th Place SE
- 2401 190th St SE
- 18920 25th Ave SE
- 2406 188th Place SE
- 2406A 188th Place SE
- 2406A 188th Place SE Unit A
- 18911 25th Ave SE
- 31 177th St SE
- 27 177th St SE
- 2313 190th St SE
- 18925 25th Ave SE
- 2511 189th St SE
- 2402 188th Place SE
- 2512 189th St SE
- 2426 190th St SE
- 2417 188th Place SE
- 18815 25th Ave SE
- 2405 188th Place SE
- 2306 190th St SE
- 19007 25th Ave SE
Your Personal Tour Guide
Ask me questions while you tour the home.