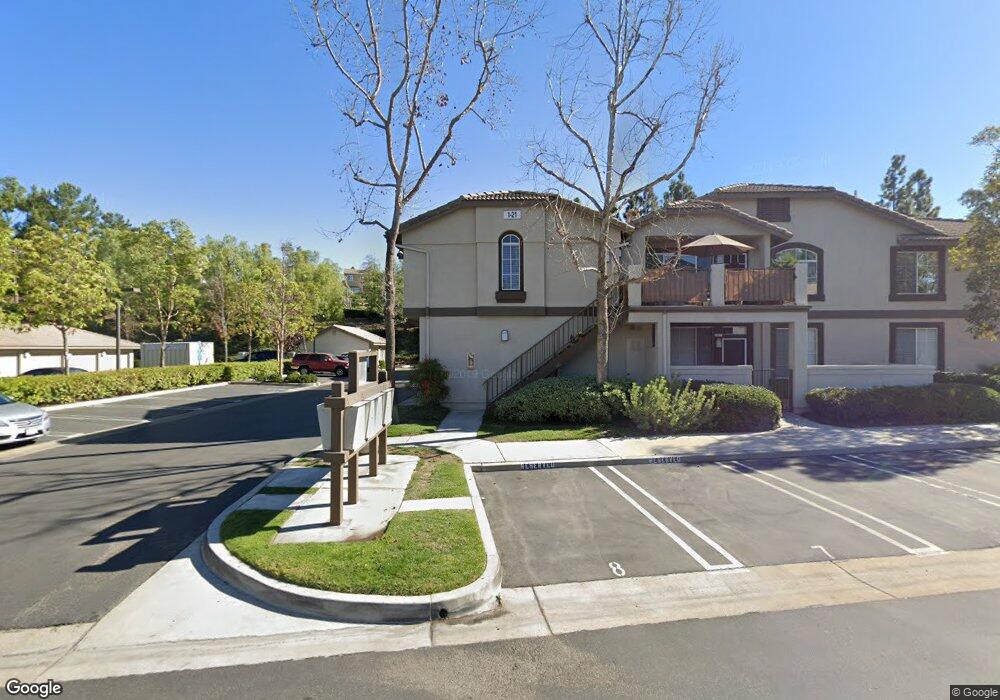
19 Chaumont Cir Foothill Ranch, CA 92610
Estimated Value: $603,344 - $680,000
2
Beds
2
Baths
1,056
Sq Ft
$593/Sq Ft
Est. Value
About This Home
This home is located at 19 Chaumont Cir, Foothill Ranch, CA 92610 and is currently estimated at $626,086, approximately $592 per square foot. 19 Chaumont Cir is a home located in Orange County with nearby schools including Foothill Ranch Elementary School, Rancho Santa Margarita Intermediate School, and Trabuco Hills High School.
Ownership History
Date
Name
Owned For
Owner Type
Purchase Details
Closed on
Jul 19, 2023
Sold by
Gandolfo Gerald Anthony
Bought by
Gerald Anthony Gandolfo Living Trust and Gandolfo
Current Estimated Value
Purchase Details
Closed on
Aug 2, 2019
Sold by
Salter Jody J and Salter Jody J
Bought by
Gandolfo Gerald A
Purchase Details
Closed on
Jun 22, 2007
Sold by
Gandolfo Gerald A and Salter Jody J
Bought by
Gandolfo Gerald A and Salter Jody L
Create a Home Valuation Report for This Property
The Home Valuation Report is an in-depth analysis detailing your home's value as well as a comparison with similar homes in the area
Home Values in the Area
Average Home Value in this Area
Purchase History
| Date | Buyer | Sale Price | Title Company |
|---|---|---|---|
| Gerald Anthony Gandolfo Living Trust | -- | None Listed On Document | |
| Gandolfo Gerald A | -- | Title365 Company | |
| Gandolfo Gerald A | -- | Fidelity National Title |
Source: Public Records
Tax History
| Year | Tax Paid | Tax Assessment Tax Assessment Total Assessment is a certain percentage of the fair market value that is determined by local assessors to be the total taxable value of land and additions on the property. | Land | Improvement |
|---|---|---|---|---|
| 2025 | $2,135 | $215,306 | $74,989 | $140,317 |
| 2024 | $2,135 | $211,085 | $73,519 | $137,566 |
| 2023 | $2,083 | $206,947 | $72,078 | $134,869 |
| 2022 | $2,117 | $202,890 | $70,665 | $132,225 |
| 2021 | $1,805 | $198,912 | $69,279 | $129,633 |
| 2020 | $2,056 | $196,873 | $68,569 | $128,304 |
| 2019 | $1,944 | $193,013 | $67,224 | $125,789 |
| 2018 | $1,906 | $189,229 | $65,906 | $123,323 |
| 2017 | $1,867 | $185,519 | $64,614 | $120,905 |
| 2016 | $2,142 | $181,882 | $63,347 | $118,535 |
| 2015 | $2,137 | $179,150 | $62,395 | $116,755 |
| 2014 | $2,376 | $175,641 | $61,173 | $114,468 |
Source: Public Records
Map
Nearby Homes
- 208 Chaumont Cir Unit 113
- 19431 14H Rue de Valore
- 19431 57D Rue de Valore
- 277 Chaumont Cir
- 19431 Rue de Valore Unit 19B
- 19431 Rue de Valore Unit 14A
- 39 Touraine Place
- 16 Balustrade Place
- 38 Tessera Ave
- 20 Flores
- 2 Alamitos
- 406 El Paseo
- 5 Encinal
- 115 Primrose Dr
- 32 Salinas
- 1161 Summit Oak Dr
- 28312 Pueblo Dr
- 64 Calle Cabrillo
- 28342 Boulder Dr
- 704 Dusky Creek
- 21 Chaumont Cir
- 17 Chaumont Cir Unit 10
- 15 Chaumont Cir
- 11 Chaumont Cir Unit 6
- 9 Chaumont Cir
- 7 Chaumont Cir
- 5 Chaumont Cir
- 3 Chaumont Cir
- 1 Chaumont Cir Unit 7
- 361 Chaumont Cir Unit 207
- 23 Chaumont Cir
- 363 Chaumont Cir
- 365 Chaumont Cir
- 2 Chaumont Cir Unit 147
- 2 Chaumont Cir
- 367 Chaumont Cir
- 25 Chaumont Cir
- 4 Chaumont Cir Unit 148
- 6 Chaumont Cir Unit 145
- 8 Chaumont Cir Unit 143
Your Personal Tour Guide
Ask me questions while you tour the home.