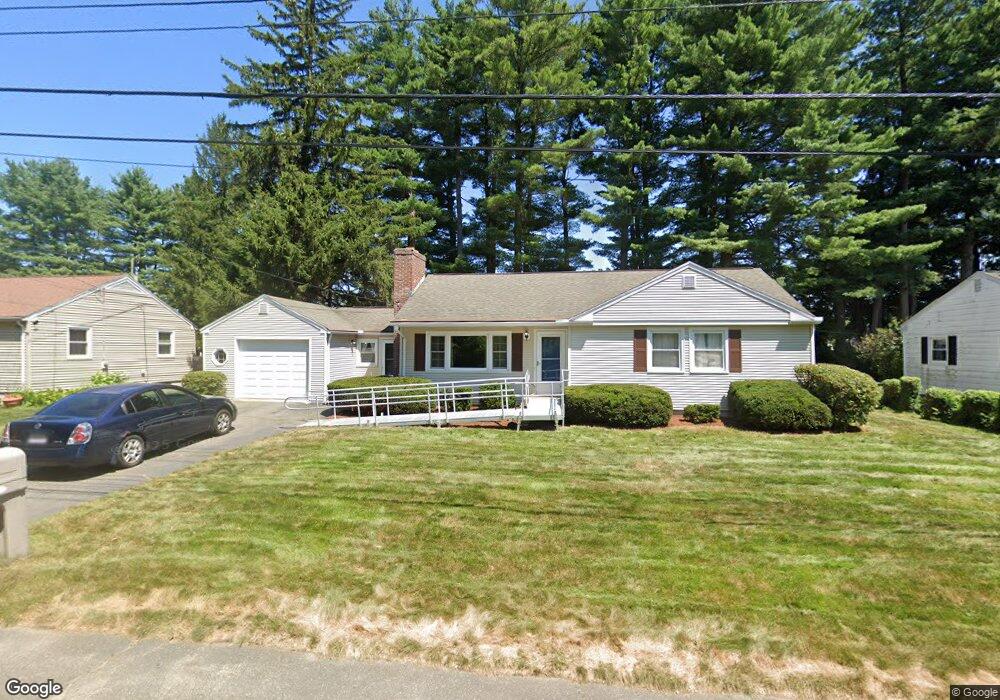
19 Flint St Springfield, MA 01129
Boston Road NeighborhoodEstimated Value: $269,000 - $328,000
3
Beds
1
Bath
1,076
Sq Ft
$283/Sq Ft
Est. Value
About This Home
This home is located at 19 Flint St, Springfield, MA 01129 and is currently estimated at $304,648, approximately $283 per square foot. 19 Flint St is a home located in Hampden County with nearby schools including Warner, M Marcus Kiley Middle, and Springfield Central High School.
Ownership History
Date
Name
Owned For
Owner Type
Purchase Details
Closed on
Sep 28, 1990
Sold by
Cooper Steven L
Bought by
Vredenburg Charles E
Current Estimated Value
Home Financials for this Owner
Home Financials are based on the most recent Mortgage that was taken out on this home.
Original Mortgage
$75,000
Interest Rate
9.95%
Mortgage Type
Purchase Money Mortgage
Create a Home Valuation Report for This Property
The Home Valuation Report is an in-depth analysis detailing your home's value as well as a comparison with similar homes in the area
Home Values in the Area
Average Home Value in this Area
Purchase History
| Date | Buyer | Sale Price | Title Company |
|---|---|---|---|
| Vredenburg Charles E | $103,000 | -- |
Source: Public Records
Mortgage History
| Date | Status | Borrower | Loan Amount |
|---|---|---|---|
| Open | Vredenburg Charles E | $75,000 | |
| Closed | Vredenburg Charles E | $74,600 | |
| Closed | Vredenburg Charles E | $75,000 |
Source: Public Records
Tax History
| Year | Tax Paid | Tax Assessment Tax Assessment Total Assessment is a certain percentage of the fair market value that is determined by local assessors to be the total taxable value of land and additions on the property. | Land | Improvement |
|---|---|---|---|---|
| 2025 | $4,508 | $287,500 | $58,200 | $229,300 |
| 2024 | $4,290 | $267,100 | $58,200 | $208,900 |
| 2023 | $3,778 | $221,600 | $55,400 | $166,200 |
| 2022 | $3,969 | $210,900 | $55,400 | $155,500 |
| 2021 | $3,563 | $188,500 | $50,300 | $138,200 |
| 2020 | $3,416 | $174,900 | $50,300 | $124,600 |
| 2019 | $3,174 | $161,300 | $50,300 | $111,000 |
| 2018 | $3,222 | $163,700 | $50,300 | $113,400 |
| 2017 | $3,036 | $154,400 | $45,300 | $109,100 |
| 2016 | $2,921 | $148,600 | $45,300 | $103,300 |
| 2015 | $3,006 | $152,800 | $45,300 | $107,500 |
Source: Public Records
Map
Nearby Homes
Your Personal Tour Guide
Ask me questions while you tour the home.