19 Ledgerock Way Durham, NC 27703
Eastern Durham NeighborhoodEstimated Value: $292,000 - $307,671
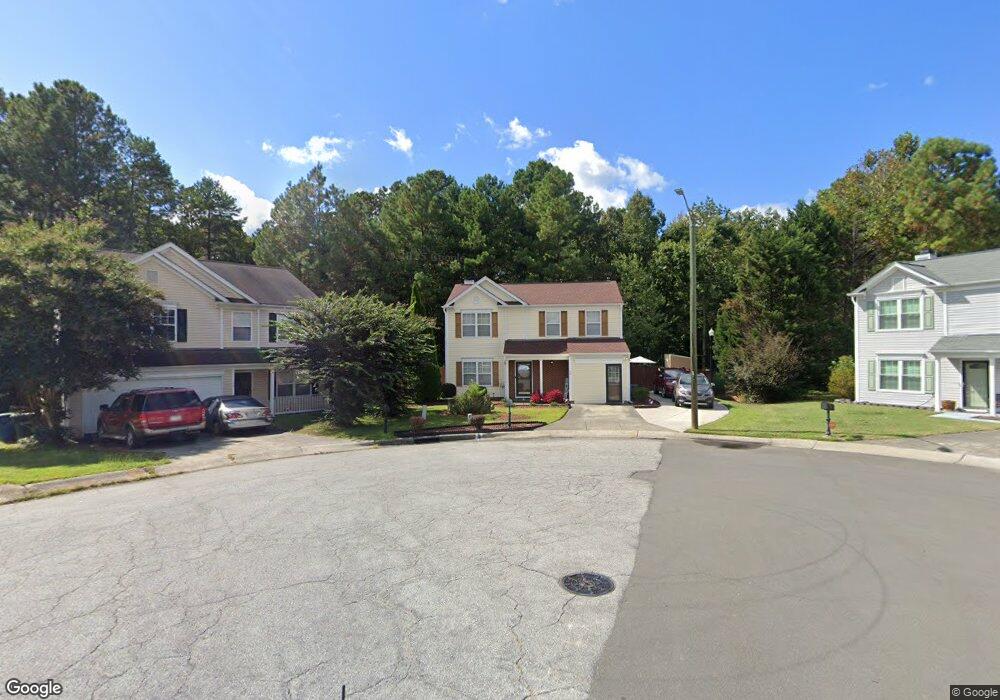
About This Home
This home is located at 19 Ledgerock Way, Durham, NC 27703 and is currently estimated at $300,418, approximately $215 per square foot. 19 Ledgerock Way is a home located in Durham County with nearby schools including Glenn Elementary, John W Neal Middle School, and Southern School of Energy & Sustainability.
Ownership History
We collect this data history from publicly available records. To have your information removed, we recommend requesting removal directly through your county’s website.
Purchase Details
Home Financials for this Owner
Home Financials are based on the most recent Mortgage that was taken out on this home.Purchase Details
Purchase Details
Home Financials for this Owner
Home Financials are based on the most recent Mortgage that was taken out on this home.Home Values in the Area
Average Home Value in this Area
Purchase History
We collect this data history from publicly available records. To have your information removed, we recommend requesting removal directly through your county’s website.
| Date | Buyer | Sale Price | Title Company |
|---|---|---|---|
| -- | None Available | ||
| -- | None Available | ||
| $122,000 | -- |
Mortgage History
We collect this data history from publicly available records. To have your information removed, we recommend requesting removal directly through your county’s website.
| Date | Status | Borrower | Loan Amount |
|---|---|---|---|
| Open | $65,000 | ||
| Previous Owner | $120,419 |
Tax History
We collect this data history from publicly available records. To have your information removed, we recommend requesting removal directly through your county’s website.
| Year | Tax Paid | Tax Assessment Tax Assessment Total Assessment is a certain percentage of the fair market value that is determined by local assessors to be the total taxable value of land and additions on the property. | Land | Improvement |
|---|---|---|---|---|
| 2025 | $2,960 | $298,550 | $74,375 | $224,175 |
| 2024 | $2,103 | $150,742 | $35,700 | $115,042 |
| 2023 | $1,975 | $150,742 | $35,700 | $115,042 |
| 2022 | $1,929 | $150,742 | $35,700 | $115,042 |
| 2021 | $1,920 | $150,742 | $35,700 | $115,042 |
| 2020 | $1,875 | $150,742 | $35,700 | $115,042 |
| 2019 | $1,875 | $150,742 | $35,700 | $115,042 |
| 2018 | $1,734 | $127,830 | $29,750 | $98,080 |
| 2017 | $1,721 | $127,830 | $29,750 | $98,080 |
| 2016 | $1,663 | $127,830 | $29,750 | $98,080 |
| 2015 | $1,818 | $131,360 | $28,800 | $102,560 |
| 2014 | $1,818 | $131,360 | $28,800 | $102,560 |
Map
- 7 Duxford Ct
- 1021 N Mineral Springs Rd
- 914 Flanders Dr
- 231 Pebblestone Dr
- 3900 Mary Martin Rd
- 3822 Mary Martin Rd
- 3801 Tyne Dr
- 909 Valmet Dr
- 913 Valmet Dr
- 5105 Hadrian Dr
- 5823 Hadrian Dr
- 1034 Statler Dr
- 109 Knightwood Dr
- 14 Fielding Ct
- 1005 Sweet Cream Ct
- 202 Bedivere Ln
- 608 Chalcedony Ct
- 1126 Sweet Cream Ct
- 6 Sugar Maple Ct
- 1125 Sweet Cream Ct
- 17 Ledgerock Way
- 20 Ledgerock Way
- 15 Ledgerock Way
- 16 Ledgerock Way
- 11 Ledgerock Way
- 14 Ledgerock Way
- 12 Ledgerock Way
- 9 Ledgerock Way
- 10 Ledgerock Way
- 112 Pebblestone Dr
- 7 Ledgerock Way
- 217 Gladstone Dr
- 6 Ledgerock Way
- 215 Gladstone Dr
- 110 Pebblestone Dr
- 301 Gladstone Dr
- 116 Pebblestone Dr
- 213 Gladstone Dr
- 303 Gladstone Dr
- 108 Pebblestone Dr
Ask me questions while you tour the home.