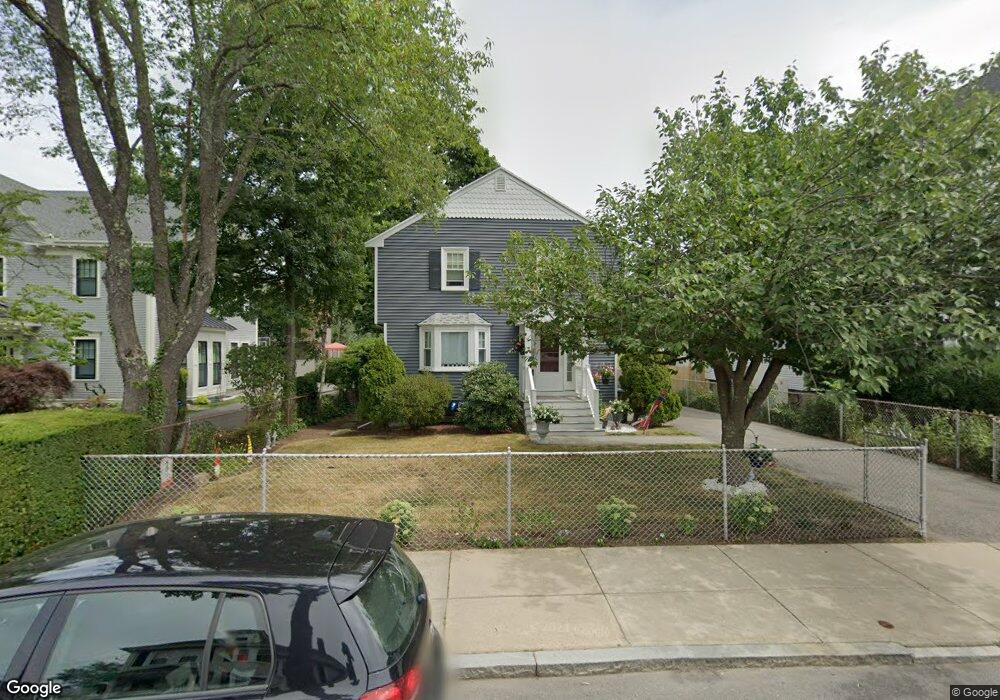
19 Maple St West Roxbury, MA 02132
West Roxbury NeighborhoodEstimated Value: $954,000 - $1,081,000
3
Beds
2
Baths
1,732
Sq Ft
$578/Sq Ft
Est. Value
About This Home
This home is located at 19 Maple St, West Roxbury, MA 02132 and is currently estimated at $1,001,436, approximately $578 per square foot. 19 Maple St is a home located in Suffolk County with nearby schools including Holy Name Parish School, St Theresa School, and The Roxbury Latin School.
Ownership History
Date
Name
Owned For
Owner Type
Purchase Details
Closed on
Aug 13, 2012
Sold by
Sheehan Bridget T
Bought by
Sheehan Bridget T and Sheehan Joan F
Current Estimated Value
Purchase Details
Closed on
Dec 17, 1997
Sold by
Mckeown Laurie A
Bought by
Sheehan Daniel J and Sheehan Bridget T
Purchase Details
Closed on
Nov 21, 1996
Sold by
Cruz Dev Corp
Bought by
Maple Commons Apts Lp
Purchase Details
Closed on
May 23, 1995
Sold by
University Bk Na
Bought by
Cruz Dev Corp
Purchase Details
Closed on
Jul 20, 1994
Sold by
Koenig Mark D and University Bk Na
Bought by
University Bk Na
Purchase Details
Closed on
Aug 6, 1987
Sold by
Lydon Paul F
Bought by
Mckleown Laurie A
Home Financials for this Owner
Home Financials are based on the most recent Mortgage that was taken out on this home.
Original Mortgage
$95,000
Interest Rate
10.29%
Purchase Details
Closed on
Mar 4, 1987
Sold by
Norton Gert C Est
Bought by
Lydon Paul F
Create a Home Valuation Report for This Property
The Home Valuation Report is an in-depth analysis detailing your home's value as well as a comparison with similar homes in the area
Home Values in the Area
Average Home Value in this Area
Purchase History
| Date | Buyer | Sale Price | Title Company |
|---|---|---|---|
| Sheehan Bridget T | -- | -- | |
| Sheehan Daniel J | $215,000 | -- | |
| Maple Commons Apts Lp | $27,560 | -- | |
| Cruz Dev Corp | $25,500 | -- | |
| University Bk Na | $170,000 | -- | |
| Mckleown Laurie A | $195,000 | -- | |
| Lydon Paul F | $112,000 | -- |
Source: Public Records
Mortgage History
| Date | Status | Borrower | Loan Amount |
|---|---|---|---|
| Previous Owner | Lydon Paul F | $98,000 | |
| Previous Owner | Lydon Paul F | $34,500 | |
| Previous Owner | Lydon Paul F | $95,000 |
Source: Public Records
Tax History Compared to Growth
Tax History
| Year | Tax Paid | Tax Assessment Tax Assessment Total Assessment is a certain percentage of the fair market value that is determined by local assessors to be the total taxable value of land and additions on the property. | Land | Improvement |
|---|---|---|---|---|
| 2025 | $10,105 | $872,600 | $351,100 | $521,500 |
| 2024 | $9,766 | $896,000 | $360,900 | $535,100 |
| 2023 | $9,075 | $845,000 | $340,300 | $504,700 |
| 2022 | $8,358 | $768,200 | $309,400 | $458,800 |
| 2021 | $7,765 | $727,700 | $297,500 | $430,200 |
| 2020 | $7,178 | $679,700 | $274,800 | $404,900 |
| 2019 | $6,693 | $635,000 | $230,400 | $404,600 |
| 2018 | $6,400 | $610,700 | $230,400 | $380,300 |
| 2017 | $6,402 | $604,500 | $230,400 | $374,100 |
| 2016 | $6,215 | $565,000 | $230,400 | $334,600 |
| 2015 | $5,912 | $488,200 | $190,900 | $297,300 |
| 2014 | $5,793 | $460,500 | $190,900 | $269,600 |
Source: Public Records
Map
Nearby Homes
- 1789 Centre St Unit 202
- 55 Redlands Rd
- 37 Hastings St Unit 103
- 110 Park St Unit 3
- 416 Belgrade Ave Unit 25
- 22 Bellevue St
- 19 Pomfret St
- 37 Pomfret St
- 168 Maple St
- 10 Burwell Rd
- 76 Potomac St
- 76 Vermont St
- 539 Lagrange St
- 311 Belgrade Ave
- 37 Montvale St Unit 2
- 150 Tyndale St Unit 2
- 425 Lagrange St Unit 203
- 54 Sturges Rd
- 701 Vfw Pkwy
- 15 White Oak Rd