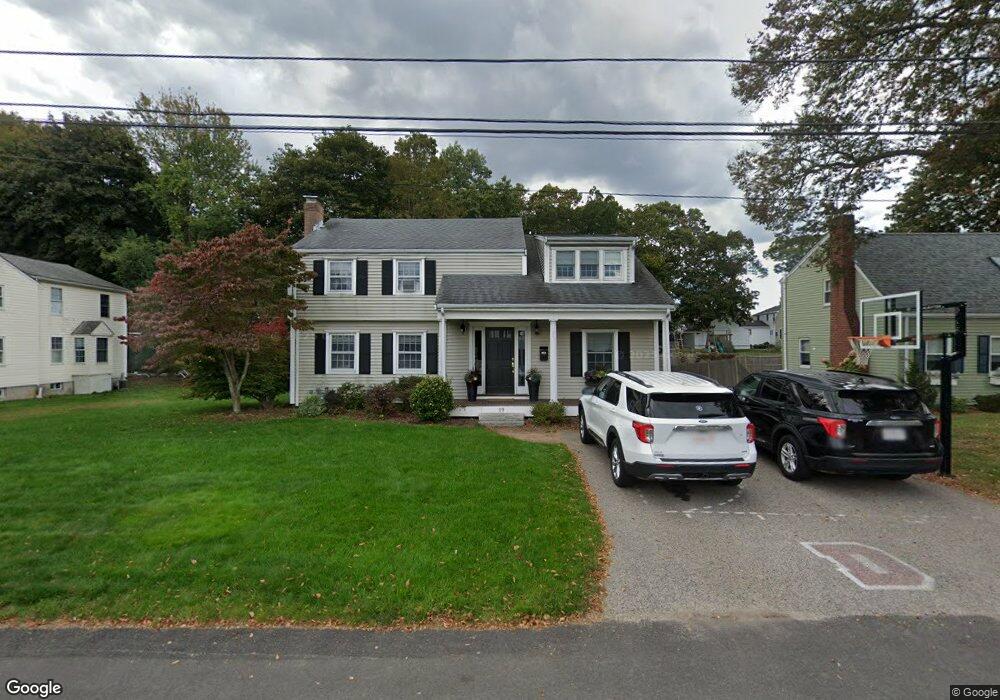
19 Netta Rd Dedham, MA 02026
Oakdale NeighborhoodEstimated Value: $822,000 - $976,000
4
Beds
3
Baths
2,164
Sq Ft
$423/Sq Ft
Est. Value
About This Home
This home is located at 19 Netta Rd, Dedham, MA 02026 and is currently estimated at $915,183, approximately $422 per square foot. 19 Netta Rd is a home located in Norfolk County with nearby schools including Oakdale Elementary School, Dedham Middle School, and Dedham High School.
Ownership History
Date
Name
Owned For
Owner Type
Purchase Details
Closed on
Aug 31, 2022
Sold by
Powers John E and Powers Laura A
Bought by
Powers Ft and Powers
Current Estimated Value
Home Financials for this Owner
Home Financials are based on the most recent Mortgage that was taken out on this home.
Original Mortgage
$200,000
Outstanding Balance
$182,166
Interest Rate
5.55%
Mortgage Type
Credit Line Revolving
Estimated Equity
$733,017
Purchase Details
Closed on
Sep 27, 1999
Sold by
Butler Robert H and Butler Janet C
Bought by
Powers John E and Powers Laura A
Home Financials for this Owner
Home Financials are based on the most recent Mortgage that was taken out on this home.
Original Mortgage
$146,250
Interest Rate
8.1%
Mortgage Type
Purchase Money Mortgage
Create a Home Valuation Report for This Property
The Home Valuation Report is an in-depth analysis detailing your home's value as well as a comparison with similar homes in the area
Home Values in the Area
Average Home Value in this Area
Purchase History
| Date | Buyer | Sale Price | Title Company |
|---|---|---|---|
| Powers Ft | -- | None Available | |
| Powers Ft | -- | None Available | |
| Powers John E | $195,000 | -- |
Source: Public Records
Mortgage History
| Date | Status | Borrower | Loan Amount |
|---|---|---|---|
| Open | Powers Ft | $200,000 | |
| Previous Owner | Powers John E | $192,000 | |
| Previous Owner | Powers John E | $146,250 | |
| Closed | Powers John E | $29,250 |
Source: Public Records
Tax History Compared to Growth
Tax History
| Year | Tax Paid | Tax Assessment Tax Assessment Total Assessment is a certain percentage of the fair market value that is determined by local assessors to be the total taxable value of land and additions on the property. | Land | Improvement |
|---|---|---|---|---|
| 2025 | $10,795 | $855,400 | $358,600 | $496,800 |
| 2024 | $10,515 | $841,200 | $330,100 | $511,100 |
| 2023 | $9,589 | $746,800 | $306,300 | $440,500 |
| 2022 | $8,870 | $664,400 | $280,200 | $384,200 |
| 2021 | $8,495 | $621,400 | $280,200 | $341,200 |
| 2020 | $8,309 | $605,600 | $268,400 | $337,200 |
| 2019 | $7,904 | $558,600 | $243,700 | $314,900 |
| 2018 | $7,800 | $536,100 | $221,200 | $314,900 |
| 2017 | $7,519 | $509,400 | $212,400 | $297,000 |
| 2016 | $7,630 | $492,600 | $188,700 | $303,900 |
| 2015 | $7,419 | $467,500 | $182,600 | $284,900 |
| 2014 | $7,683 | $477,800 | $182,600 | $295,200 |
Source: Public Records
Map
Nearby Homes
- 94 Madison St
- 414 Cedar St
- 183 Grant Ave
- 17 Savin St
- 18 Boulevard Rd
- 50 Sprague St
- 94 Border St
- 12 Tarbox St
- 79 Sprague St
- 10 Fairview St
- 22 Azalea Cir
- 989 East St Unit 107
- 989 East St Unit 403
- 155 Mount Vernon St
- 27 Edison Ave
- 111 Greensboro Rd
- 3 S Stone Mill Dr Unit 221
- 82 Bonham Rd
- 116 Bonham Rd
- 163 Whiting Ave