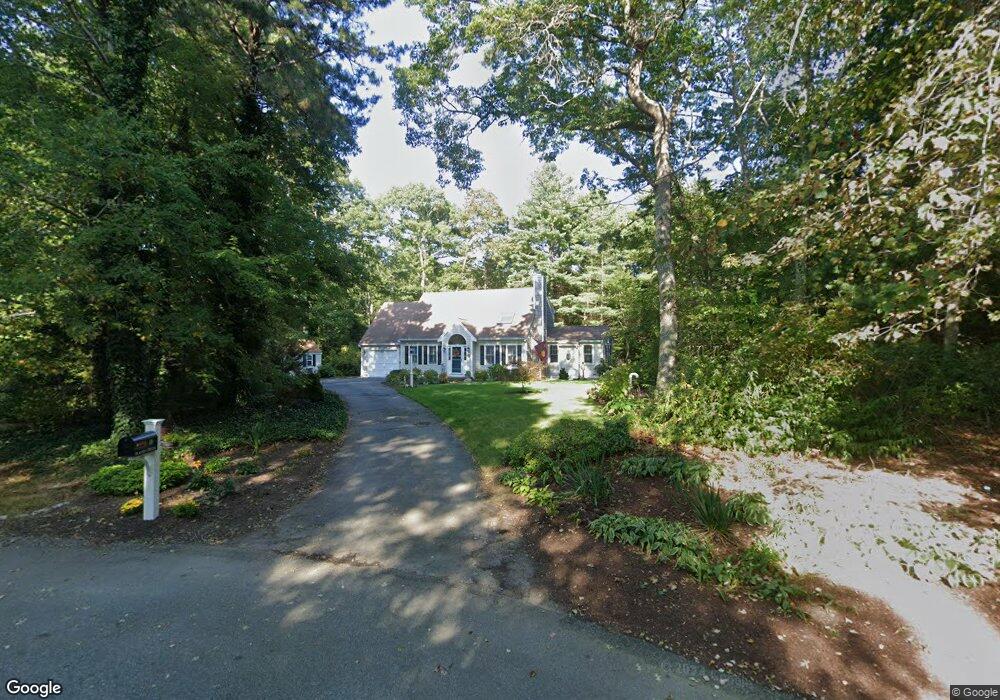
19 Player Cir Mashpee, MA 02649
Estimated Value: $692,000 - $790,000
3
Beds
2
Baths
1,444
Sq Ft
$507/Sq Ft
Est. Value
About This Home
This home is located at 19 Player Cir, Mashpee, MA 02649 and is currently estimated at $732,566, approximately $507 per square foot. 19 Player Cir is a home located in Barnstable County with nearby schools including Kenneth C. Coombs School, Quashnet School, and Mashpee Middle School.
Ownership History
Date
Name
Owned For
Owner Type
Purchase Details
Closed on
Aug 5, 2025
Sold by
Barron John R and Barron Patricia
Bought by
Barron John R and Barron Patricia T
Current Estimated Value
Purchase Details
Closed on
Jun 20, 2014
Sold by
Clegg Susan K
Bought by
Barron John R and Barron Patricia
Home Financials for this Owner
Home Financials are based on the most recent Mortgage that was taken out on this home.
Original Mortgage
$187,800
Interest Rate
4.21%
Mortgage Type
New Conventional
Purchase Details
Closed on
Oct 6, 1993
Sold by
Prime Properties Rt
Bought by
Clegg Richard H and Clegg Susan K
Purchase Details
Closed on
Aug 11, 1993
Sold by
Lacava Anthony J
Bought by
Prime Properties Rt
Create a Home Valuation Report for This Property
The Home Valuation Report is an in-depth analysis detailing your home's value as well as a comparison with similar homes in the area
Purchase History
| Date | Buyer | Sale Price | Title Company |
|---|---|---|---|
| Barron John R | -- | -- | |
| Barron John R | -- | -- | |
| Barron John R | $313,000 | -- | |
| Barron John R | $313,000 | -- | |
| Clegg Richard H | $133,250 | -- | |
| Clegg Richard H | $133,250 | -- | |
| Prime Properties Rt | $30,000 | -- | |
| Prime Properties Rt | $30,000 | -- |
Source: Public Records
Mortgage History
| Date | Status | Borrower | Loan Amount |
|---|---|---|---|
| Previous Owner | Barron John R | $187,800 | |
| Previous Owner | Prime Properties Rt | $30,000 | |
| Previous Owner | Prime Properties Rt | $30,000 |
Source: Public Records
Tax History
| Year | Tax Paid | Tax Assessment Tax Assessment Total Assessment is a certain percentage of the fair market value that is determined by local assessors to be the total taxable value of land and additions on the property. | Land | Improvement |
|---|---|---|---|---|
| 2025 | $4,676 | $706,400 | $253,400 | $453,000 |
| 2024 | $4,371 | $679,800 | $248,100 | $431,700 |
| 2023 | $4,138 | $590,300 | $236,200 | $354,100 |
| 2022 | $3,934 | $481,500 | $192,100 | $289,400 |
| 2021 | $3,630 | $400,200 | $179,200 | $221,000 |
| 2020 | $3,525 | $387,800 | $172,300 | $215,500 |
| 2019 | $3,368 | $372,200 | $172,300 | $199,900 |
| 2018 | $2,944 | $330,000 | $172,300 | $157,700 |
| 2017 | $2,898 | $315,300 | $172,300 | $143,000 |
| 2016 | $2,837 | $307,000 | $172,300 | $134,700 |
| 2015 | $2,745 | $301,300 | $172,300 | $129,000 |
| 2014 | $2,774 | $295,400 | $166,700 | $128,700 |
Source: Public Records
Map
Nearby Homes
- 86 Lowell Rd
- 11 Watson Dr
- 94 Lowell Rd
- 80 Pine Hill Blvd Unit 80
- 18 Executive Dr Unit 18
- 18 Windward St Unit 18
- 94 Pine Hill Blvd Unit 94
- 50 Pine Hill Blvd Unit 46
- 50 Pine Hill Blvd
- 1 Upland Cir
- 1 Upland Cir Unit 1
- 22 Country Club Ln
- 34 Bonwood Dr
- 10 Kettle Ln
- 12 Kettle Ln
- 12 Kettle Ln Unit 31
- 16 Grey Hawk Dr Unit 16
- 153 Leisure Green Dr
- 153 Leisure Green Dr Unit 749
- 1 Par Three Ct Unit 1
- 21 Player Cir
- 17 Player Cir
- 18 Player Cir
- 11 Player Cir
- 10 Player Cir
- 238 Old Barnstable Rd
- 209 Old Barnstable Rd
- 203 Old Barnstable Rd
- 5 Player Cir
- 1 Snead Dr
- 583 Great Hay Rd
- 2 Player Cir
- 4 Palmer Rd
- 197 Old Barnstable Rd
- 5 Casper Cir
- 3 Snead Dr
- 1 Player Cir
- 11 Casper Cir
- 7 Snead Dr
- 185 Old Barnstable Rd
Your Personal Tour Guide
Ask me questions while you tour the home.