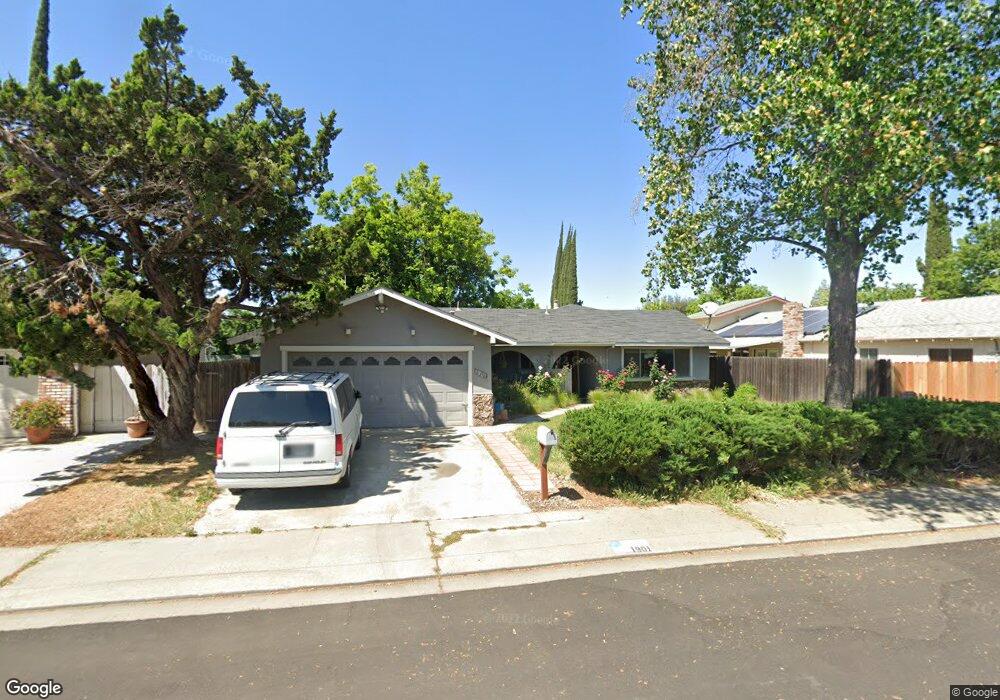
1901 Milpas Ln Modesto, CA 95355
Northeast Modesto NeighborhoodEstimated Value: $387,000 - $423,000
3
Beds
1
Bath
1,396
Sq Ft
$292/Sq Ft
Est. Value
About This Home
This home is located at 1901 Milpas Ln, Modesto, CA 95355 and is currently estimated at $407,358, approximately $291 per square foot. 1901 Milpas Ln is a home located in Stanislaus County with nearby schools including Coleman F. Brown Elementary School, Daniel J. Savage Middle School, and Fred C. Beyer High School.
Ownership History
Date
Name
Owned For
Owner Type
Purchase Details
Closed on
Jul 6, 2009
Sold by
Mcgann Michael J and Mcgann Karen J
Bought by
Dickey Ross E
Current Estimated Value
Home Financials for this Owner
Home Financials are based on the most recent Mortgage that was taken out on this home.
Original Mortgage
$136,482
Outstanding Balance
$86,695
Interest Rate
4.87%
Mortgage Type
FHA
Estimated Equity
$320,663
Purchase Details
Closed on
May 15, 2007
Sold by
Mcgann Michael J and Mcgann Karen K
Bought by
Mcgann Michael J and Mcgann Karen K
Purchase Details
Closed on
Jan 7, 2005
Sold by
Hari Rose Mary L and Hari Hira L
Bought by
Mcgann Michael J and Mcgann Karen K
Home Financials for this Owner
Home Financials are based on the most recent Mortgage that was taken out on this home.
Original Mortgage
$219,990
Interest Rate
5.75%
Mortgage Type
Purchase Money Mortgage
Create a Home Valuation Report for This Property
The Home Valuation Report is an in-depth analysis detailing your home's value as well as a comparison with similar homes in the area
Home Values in the Area
Average Home Value in this Area
Purchase History
| Date | Buyer | Sale Price | Title Company |
|---|---|---|---|
| Dickey Ross E | $139,000 | Placer Title Company | |
| Mcgann Michael J | -- | None Available | |
| Mcgann Michael J | $275,000 | First American Title Co |
Source: Public Records
Mortgage History
| Date | Status | Borrower | Loan Amount |
|---|---|---|---|
| Open | Dickey Ross E | $136,482 | |
| Previous Owner | Mcgann Michael J | $219,990 |
Source: Public Records
Tax History
| Year | Tax Paid | Tax Assessment Tax Assessment Total Assessment is a certain percentage of the fair market value that is determined by local assessors to be the total taxable value of land and additions on the property. | Land | Improvement |
|---|---|---|---|---|
| 2025 | $1,982 | $179,407 | $45,171 | $134,236 |
| 2024 | $1,947 | $175,890 | $44,286 | $131,604 |
| 2023 | $1,910 | $172,442 | $43,418 | $129,024 |
| 2022 | $1,832 | $169,062 | $42,567 | $126,495 |
| 2021 | $1,800 | $165,748 | $41,733 | $124,015 |
| 2020 | $1,774 | $164,050 | $41,306 | $122,744 |
| 2019 | $1,742 | $160,835 | $40,497 | $120,338 |
| 2018 | $1,708 | $157,682 | $39,703 | $117,979 |
| 2017 | $1,667 | $154,591 | $38,925 | $115,666 |
| 2016 | $1,657 | $151,561 | $38,162 | $113,399 |
| 2015 | $1,633 | $149,285 | $37,589 | $111,696 |
| 2014 | $1,627 | $146,362 | $36,853 | $109,509 |
Source: Public Records
Map
Nearby Homes
- 1813 Rose Ave
- 1909 Devin Dr
- 2210 San Blas Ct
- 1837 Celeste Dr
- 2313 San Rafael Ave
- 1900 Ellison Dr
- 1428 Kent Way
- 1904 Kendall Ave
- 1125 Athens Ave
- 1177 Norwegian Ave Unit 8
- 1805 Kienitz Ave
- 1217 Karen Way
- 1509 Duportail Ave
- 1805 E Orangeburg Ave
- 2307 Oakdale Rd Unit 13
- 1313 Floyd Ave Unit 176
- 1313 Floyd Ave Unit 119
- 1313 Floyd Ave Unit 122
- 1309 Nelda Way
- 1509 Maplehill Rd
Your Personal Tour Guide
Ask me questions while you tour the home.