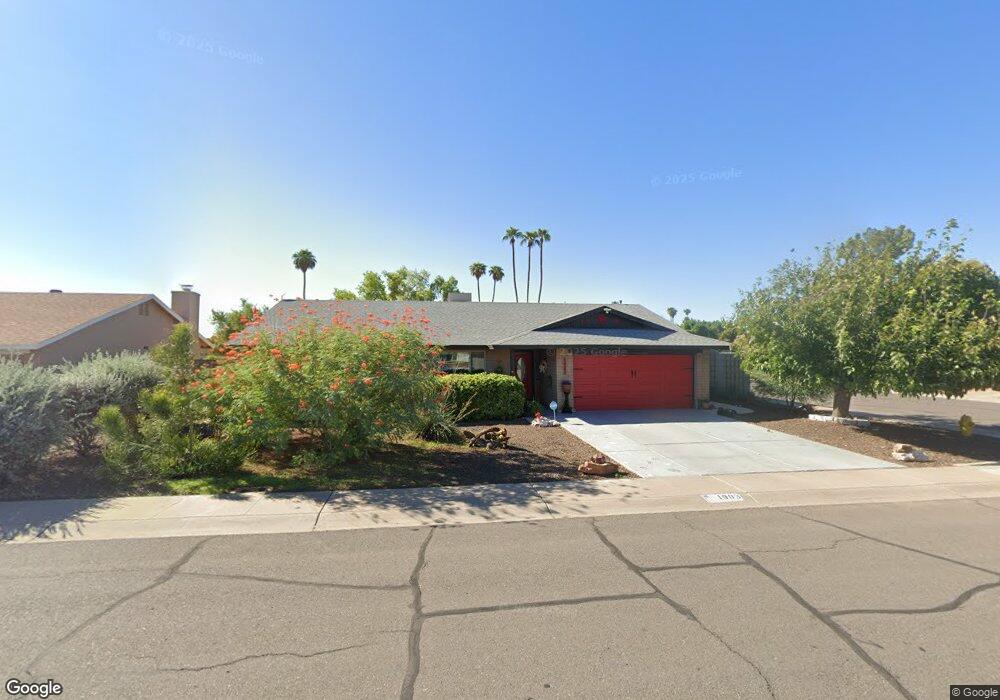
1903 E Carson Dr Tempe, AZ 85282
The Lakes NeighborhoodEstimated Value: $461,575 - $581,000
Studio
2
Baths
1,893
Sq Ft
$286/Sq Ft
Est. Value
About This Home
This home is located at 1903 E Carson Dr, Tempe, AZ 85282 and is currently estimated at $542,144, approximately $286 per square foot. 1903 E Carson Dr is a home located in Maricopa County with nearby schools including Fuller Elementary School, Fees College Preparatory Middle School, and McClintock High School.
Ownership History
Date
Name
Owned For
Owner Type
Purchase Details
Closed on
Sep 3, 2021
Sold by
Jones Daniel D
Bought by
Jones Daniel D and Long Jones Carrie
Current Estimated Value
Home Financials for this Owner
Home Financials are based on the most recent Mortgage that was taken out on this home.
Original Mortgage
$140,000
Outstanding Balance
$106,863
Interest Rate
2.1%
Mortgage Type
New Conventional
Estimated Equity
$435,281
Purchase Details
Closed on
Jun 26, 2006
Sold by
Brown Raymond Lloyd and Brown Margaret Elaine
Bought by
Jones Daniel D
Home Financials for this Owner
Home Financials are based on the most recent Mortgage that was taken out on this home.
Original Mortgage
$277,500
Outstanding Balance
$164,016
Interest Rate
6.57%
Mortgage Type
New Conventional
Estimated Equity
$378,128
Purchase Details
Closed on
Sep 22, 1997
Sold by
Brown Wendy Rae and Kunkel Mary A
Bought by
Brown Raymond Lloyd and Brown Margaret Elaine
Create a Home Valuation Report for This Property
The Home Valuation Report is an in-depth analysis detailing your home's value as well as a comparison with similar homes in the area
Home Values in the Area
Average Home Value in this Area
Purchase History
| Date | Buyer | Sale Price | Title Company |
|---|---|---|---|
| Jones Daniel D | -- | Title365 | |
| Jones Daniel D | $327,500 | Capital Title Agency Inc | |
| Brown Raymond Lloyd | -- | -- |
Source: Public Records
Mortgage History
| Date | Status | Borrower | Loan Amount |
|---|---|---|---|
| Open | Jones Daniel D | $140,000 | |
| Open | Jones Daniel D | $277,500 |
Source: Public Records
Tax History
| Year | Tax Paid | Tax Assessment Tax Assessment Total Assessment is a certain percentage of the fair market value that is determined by local assessors to be the total taxable value of land and additions on the property. | Land | Improvement |
|---|---|---|---|---|
| 2025 | $2,320 | $22,257 | -- | -- |
| 2024 | $2,129 | $21,197 | -- | -- |
| 2023 | $2,129 | $40,470 | $8,090 | $32,380 |
| 2022 | $2,033 | $29,360 | $5,870 | $23,490 |
| 2021 | $2,073 | $27,150 | $5,430 | $21,720 |
| 2020 | $2,004 | $25,880 | $5,170 | $20,710 |
| 2019 | $1,966 | $23,800 | $4,760 | $19,040 |
| 2018 | $1,913 | $22,400 | $4,480 | $17,920 |
| 2017 | $1,853 | $20,770 | $4,150 | $16,620 |
| 2016 | $1,845 | $20,370 | $4,070 | $16,300 |
| 2015 | $1,784 | $17,980 | $3,590 | $14,390 |
Source: Public Records
Map
Nearby Homes
- 1938 E Greenway Dr
- 1985 E Carson Dr
- 4705 S Country Club Way
- 4723 S Country Club Way
- 1959 E Dunbar Dr
- 1813 E Ellis Dr
- 1924 E Duke Dr
- 1941 E Pebble Beach Dr
- 1623 E Baker Dr
- 2115 E Greenway Dr
- 1722 E La Jolla Dr
- 1638 E Donner Dr
- 1717 E Pebble Beach Dr Unit 6
- 4811 S Birch St
- 4815 S Birch St
- 5011 S Birch St
- 4616 S Poplar St
- 4804 S Elm St
- 5014 S Elm St
- 3922 S Poplar St
- 1909 E Carson Dr
- 4615 S Hazelton Ln
- 1915 E Carson Dr
- 4608 S Hazelton Ln
- 4602 S Hazelton Ln
- 4614 S Hazelton Ln
- 1904 E Carson Dr
- 4623 S Hazelton Ln
- 1912 E Fremont Dr
- 1910 E Carson Dr Unit 4
- 4522 S Hazelton Ln
- 1921 E Carson Dr Unit 4
- 4620 S Hazelton Ln
- 1916 E Carson Dr
- 4516 S Hazelton Ln
- 1918 E Fremont Dr
- 4626 S Hazelton Ln
- 1922 E Carson Dr
- 1927 E Carson Dr
- 4607 S Los Feliz Dr
Your Personal Tour Guide
Ask me questions while you tour the home.