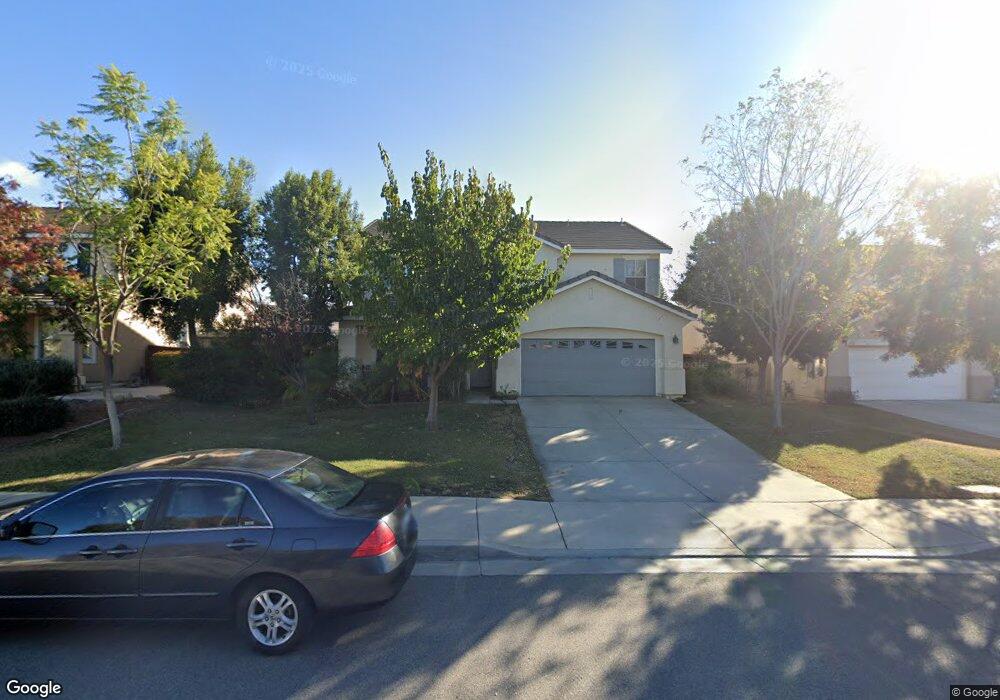
19049 Clover Ct Riverside, CA 92508
Orangecrest NeighborhoodEstimated Value: $690,000 - $788,000
4
Beds
3
Baths
2,771
Sq Ft
$266/Sq Ft
Est. Value
About This Home
This home is located at 19049 Clover Ct, Riverside, CA 92508 and is currently estimated at $737,380, approximately $266 per square foot. 19049 Clover Ct is a home located in Riverside County with nearby schools including Mark Twain Elementary School, Frank Augustus Miller Middle School, and Martin Luther King Junior High School.
Ownership History
Date
Name
Owned For
Owner Type
Purchase Details
Closed on
Oct 3, 2025
Sold by
Tyson David A and Tyson Maria Blanca
Bought by
Tyson Family Trust and Tyson
Current Estimated Value
Purchase Details
Closed on
Apr 4, 2003
Sold by
Tyson David A
Bought by
Tyson David A and Tyson Blanca E
Home Financials for this Owner
Home Financials are based on the most recent Mortgage that was taken out on this home.
Original Mortgage
$272,700
Interest Rate
6.99%
Purchase Details
Closed on
Mar 27, 2003
Sold by
Tyson David A and Tyson Blanca E
Bought by
Tyson David A
Home Financials for this Owner
Home Financials are based on the most recent Mortgage that was taken out on this home.
Original Mortgage
$272,700
Interest Rate
6.99%
Purchase Details
Closed on
Apr 20, 2001
Sold by
Kb Home Of Greater Los Angeles Inc
Bought by
Tyson David A and Tyson Blanca E
Home Financials for this Owner
Home Financials are based on the most recent Mortgage that was taken out on this home.
Original Mortgage
$238,400
Interest Rate
6.73%
Create a Home Valuation Report for This Property
The Home Valuation Report is an in-depth analysis detailing your home's value as well as a comparison with similar homes in the area
Home Values in the Area
Average Home Value in this Area
Purchase History
We collect this data history from publicly available records. To have your information removed, we recommend requesting removal directly through your county’s website.
| Date | Buyer | Sale Price | Title Company |
|---|---|---|---|
| Tyson Family Trust | -- | None Listed On Document | |
| Tyson David A | -- | None Listed On Document | |
| Tyson David A | -- | First American Title Co | |
| Tyson David A | -- | First American Title Ins Co | |
| Tyson David A | $246,000 | First American Title Co |
Source: Public Records
Mortgage History
We collect this data history from publicly available records. To have your information removed, we recommend requesting removal directly through your county’s website.
| Date | Status | Borrower | Loan Amount |
|---|---|---|---|
| Previous Owner | Tyson David A | $272,700 | |
| Previous Owner | Tyson David A | $238,400 |
Source: Public Records
Tax History
| Year | Tax Paid | Tax Assessment Tax Assessment Total Assessment is a certain percentage of the fair market value that is determined by local assessors to be the total taxable value of land and additions on the property. | Land | Improvement |
|---|---|---|---|---|
| 2025 | $4,011 | $368,557 | $88,621 | $279,936 |
| 2023 | $4,011 | $354,248 | $85,181 | $269,067 |
| 2022 | $3,919 | $347,303 | $83,511 | $263,792 |
| 2021 | $3,871 | $340,494 | $81,874 | $258,620 |
| 2020 | $3,842 | $337,004 | $81,035 | $255,969 |
| 2019 | $3,770 | $330,397 | $79,447 | $250,950 |
| 2018 | $3,697 | $323,920 | $77,891 | $246,029 |
| 2017 | $3,632 | $317,569 | $76,364 | $241,205 |
| 2016 | $3,399 | $311,343 | $74,867 | $236,476 |
| 2015 | $3,351 | $306,669 | $73,744 | $232,925 |
| 2014 | $3,392 | $300,663 | $72,300 | $228,363 |
Source: Public Records
Map
Nearby Homes
- 9220 Village Way
- 9253 Sunridge Dr
- 19284 Krameria Ave
- 9406 Kentfield Ct
- 9406 Hampstead Ct
- 18668 Alderbrook Dr
- 9057 Mandarin Ln
- 19530 Chinotto Ln
- 9552 Glenmore Forest Dr
- 9567 Silverstein Dr
- 0 Colt St
- 19465 Kinnow Ln
- 19540 Chinotto Ln
- 9560 Glenmore Forest Dr
- 9565 Glenmore Forest Dr
- 9568 Glenmore Forest Dr
- 9573 Glenmore Forest Dr
- 18625 Krameria Ave
- 19105 Laurelhurst Ave
- 19097 Laurelhurst Ave
- 19039 Clover Ct
- 19059 Clover Ct
- 19048 Springbrook Ct
- 19038 Springbrook Ct
- 19069 Clover Ct
- 19058 Springbrook Ct
- 19029 Clover Ct
- 19028 Springbrook Ct
- 19068 Springbrook Ct
- 19048 Clover Ct
- 19058 Clover Ct
- 19038 Clover Ct
- 19028 Clover Ct
- 0 Wood Rd Unit P618358
- 0 Wood Rd Unit I08054825
- 0 Wood Rd Unit I08103095
- 0 Wood Rd Unit H740726
- 0 Wood Rd Unit I10004381
- 0 Wood Rd Unit I10074369
- 0 Wood Rd Unit P752277
Your Personal Tour Guide
Ask me questions while you tour the home.