Estimated Value: $436,867 - $455,000
3
Beds
2
Baths
1,437
Sq Ft
$310/Sq Ft
Est. Value
About This Home
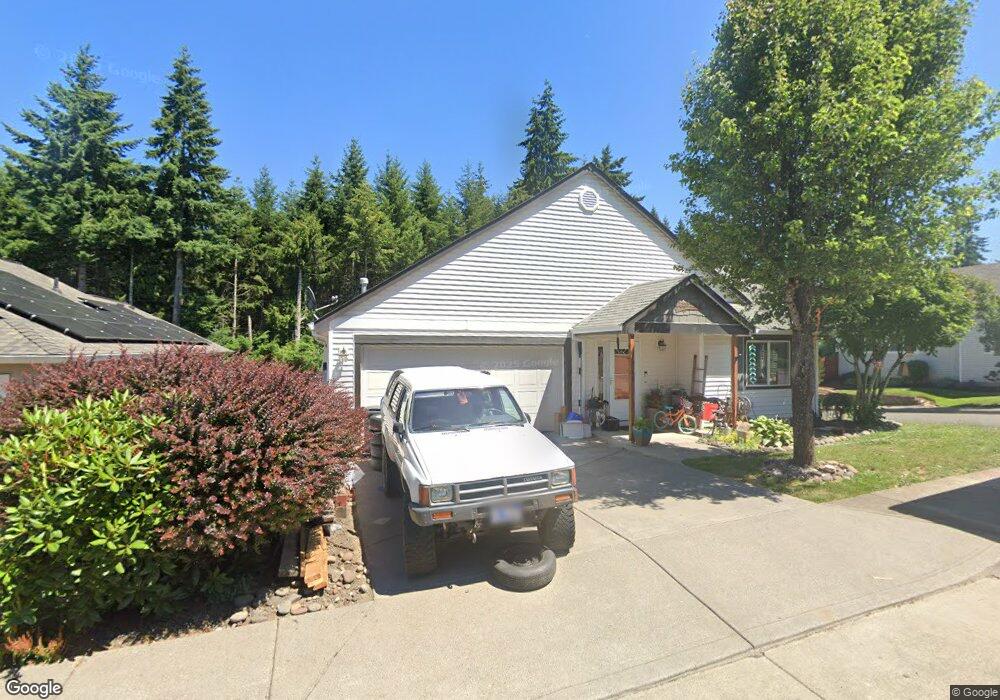
This home is located at 19144 Wallingford Ave, Sandy, OR 97055 and is currently estimated at $445,217, approximately $309 per square foot. 19144 Wallingford Ave is a home with nearby schools including Firwood Elementary School, Cedar Ridge Middle School, and Sandy High School.
Ownership History
Date
Name
Owned For
Owner Type
Purchase Details
Closed on
Mar 5, 2018
Sold by
Finn Patrcia Ann and Dorothy Jerger Testametary Tru
Bought by
Gilbert Rebecca L and Gilbert Dustin R
Current Estimated Value
Home Financials for this Owner
Home Financials are based on the most recent Mortgage that was taken out on this home.
Original Mortgage
$279,837
Outstanding Balance
$241,145
Interest Rate
4.62%
Mortgage Type
FHA
Estimated Equity
$204,072
Purchase Details
Closed on
Aug 24, 2015
Sold by
Sugahiro William Y
Bought by
Finn Patricia Ann and Dorothy Jerger Testamentary Trust
Purchase Details
Closed on
Oct 30, 2003
Sold by
Sugahiro William Y
Bought by
Sugahiro William Y and The Dorothy Jerger Testamentary Trust
Purchase Details
Closed on
May 7, 2002
Sold by
Mgd Properties Llc
Bought by
Oakley Donald W and Oakley Maria G
Home Financials for this Owner
Home Financials are based on the most recent Mortgage that was taken out on this home.
Original Mortgage
$120,000
Interest Rate
6.5%
Mortgage Type
Construction
Create a Home Valuation Report for This Property
The Home Valuation Report is an in-depth analysis detailing your home's value as well as a comparison with similar homes in the area
Home Values in the Area
Average Home Value in this Area
Purchase History
| Date | Buyer | Sale Price | Title Company |
|---|---|---|---|
| Gilbert Rebecca L | $285,000 | First American Title | |
| Finn Patricia Ann | -- | None Available | |
| Sugahiro William Y | -- | -- | |
| Oakley Donald W | $48,000 | Chicago Title Insurance Co |
Source: Public Records
Mortgage History
| Date | Status | Borrower | Loan Amount |
|---|---|---|---|
| Open | Gilbert Rebecca L | $279,837 | |
| Previous Owner | Oakley Donald W | $120,000 |
Source: Public Records
Tax History Compared to Growth
Tax History
| Year | Tax Paid | Tax Assessment Tax Assessment Total Assessment is a certain percentage of the fair market value that is determined by local assessors to be the total taxable value of land and additions on the property. | Land | Improvement |
|---|---|---|---|---|
| 2024 | $3,671 | $216,908 | -- | -- |
| 2023 | $3,671 | $210,591 | $0 | $0 |
| 2022 | $3,478 | $204,458 | $0 | $0 |
| 2021 | $3,358 | $198,503 | $0 | $0 |
| 2020 | $3,267 | $192,722 | $0 | $0 |
| 2019 | $3,236 | $187,109 | $0 | $0 |
| 2018 | $3,145 | $181,659 | $0 | $0 |
| 2017 | $3,069 | $176,368 | $0 | $0 |
| 2016 | $2,964 | $171,231 | $0 | $0 |
| 2015 | $2,880 | $166,244 | $0 | $0 |
| 2014 | $2,804 | $161,402 | $0 | $0 |
Source: Public Records
Map
Nearby Homes
- 19017 Wellesley Ave
- 38859 Jerger St
- 18712 Cloud Cap Ave
- 18653 Van Fleet Ave
- 39584 Wall St
- 39784 Syblon Ln
- 39355 Glover Ct
- 19257 Oak Ave
- 38581 Limerick St
- 38409 Juniper St
- 18462 SE Langensand Rd
- 38737 Barlow Pkwy
- 19135 SE Village Blvd
- 19003 Village Blvd
- 37999 Juniper St
- 18155 Tupper Rd
- 37996 Juniper St
- 18461 Meadow Ave
- 37945 Cascadia Village Dr
- 38851 Sandy Heights St
- 19132 Wallingford Ave
- 0 SE Jacoby Rd
- 39359 Newton St
- 39398 Amherst St
- 19118 Wallingford Ave
- 39362 Stratford Place
- 39337 Newton St
- 39396 Amherst St
- 39342 Newton St
- 19100 Wallingford Ave
- 39322 Stratford Place
- 39320 Newton St
- 39315 Newton St
- 39394 Amherst St
- 39302 Stratford Place
- 19086 Wallingford Ave
- 39308 Newton St
- 39392 Amherst St
- 39288 Stratford Place
- 39293 Newton St