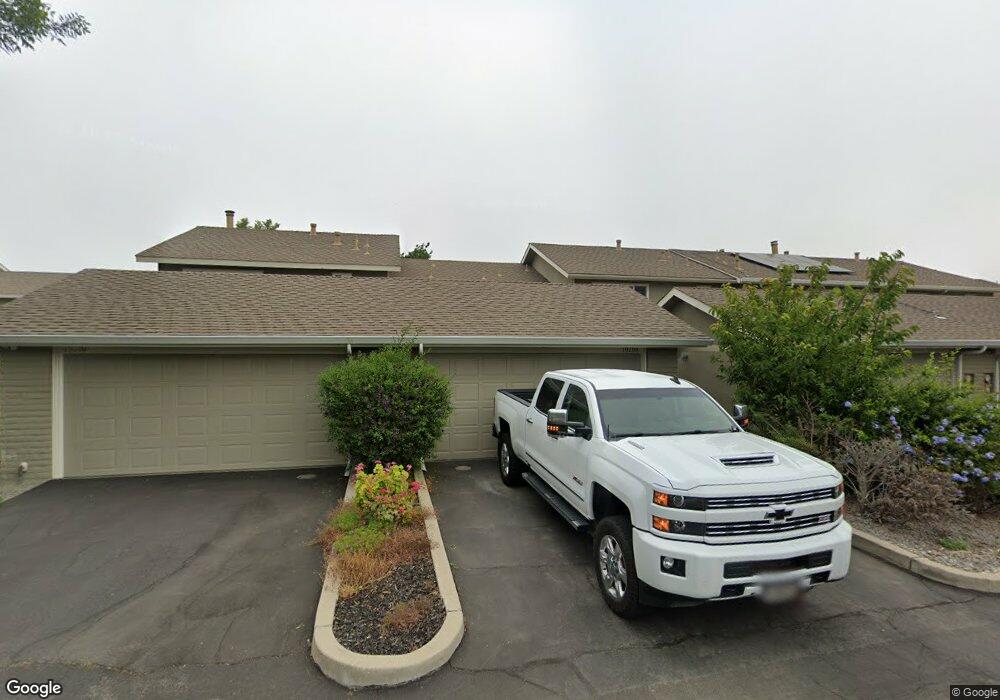
19208 Creekside Ln Unit 99 Salinas, CA 93908
Toro Park NeighborhoodEstimated Value: $673,091 - $890,000
3
Beds
2
Baths
1,358
Sq Ft
$552/Sq Ft
Est. Value
About This Home
This home is located at 19208 Creekside Ln Unit 99, Salinas, CA 93908 and is currently estimated at $750,023, approximately $552 per square foot. 19208 Creekside Ln Unit 99 is a home located in Monterey County with nearby schools including Spreckels Elementary School, Buena Vista Middle School, and Salinas High School.
Ownership History
Date
Name
Owned For
Owner Type
Purchase Details
Closed on
Feb 17, 2004
Sold by
Rover Arnold M and Rover Marilyn
Bought by
Rover Arnold Michael and Rover Marilyn
Current Estimated Value
Purchase Details
Closed on
Aug 26, 2003
Sold by
Yoakum Roland E and Yoakum Carolyn A
Bought by
Rover Arnold M and Rover Marilyn
Home Financials for this Owner
Home Financials are based on the most recent Mortgage that was taken out on this home.
Original Mortgage
$100,000
Outstanding Balance
$44,339
Interest Rate
5.6%
Mortgage Type
Unknown
Estimated Equity
$705,684
Purchase Details
Closed on
Dec 10, 1993
Sold by
Little Jeffrey W and Little Cloyse E
Bought by
Yoakum Roland E and Yoakum Carolyn A
Home Financials for this Owner
Home Financials are based on the most recent Mortgage that was taken out on this home.
Original Mortgage
$144,028
Interest Rate
7.09%
Mortgage Type
Assumption
Create a Home Valuation Report for This Property
The Home Valuation Report is an in-depth analysis detailing your home's value as well as a comparison with similar homes in the area
Home Values in the Area
Average Home Value in this Area
Purchase History
| Date | Buyer | Sale Price | Title Company |
|---|---|---|---|
| Rover Arnold Michael | -- | -- | |
| Rover Arnold M | $347,000 | First American Title | |
| Yoakum Roland E | $165,000 | Stewart Title |
Source: Public Records
Mortgage History
| Date | Status | Borrower | Loan Amount |
|---|---|---|---|
| Open | Rover Arnold M | $100,000 | |
| Previous Owner | Yoakum Roland E | $144,028 | |
| Closed | Yoakum Roland E | $17,062 |
Source: Public Records
Tax History Compared to Growth
Tax History
| Year | Tax Paid | Tax Assessment Tax Assessment Total Assessment is a certain percentage of the fair market value that is determined by local assessors to be the total taxable value of land and additions on the property. | Land | Improvement |
|---|---|---|---|---|
| 2025 | $5,512 | $493,364 | $213,269 | $280,095 |
| 2024 | $5,512 | $483,691 | $209,088 | $274,603 |
| 2023 | $5,324 | $474,208 | $204,989 | $269,219 |
| 2022 | $5,337 | $464,911 | $200,970 | $263,941 |
| 2021 | $5,105 | $455,796 | $197,030 | $258,766 |
| 2020 | $4,987 | $451,123 | $195,010 | $256,113 |
| 2019 | $4,959 | $442,279 | $191,187 | $251,092 |
| 2018 | $4,891 | $433,608 | $187,439 | $246,169 |
| 2017 | $5,002 | $425,107 | $183,764 | $241,343 |
| 2016 | $4,369 | $377,000 | $163,000 | $214,000 |
| 2015 | $4,371 | $370,000 | $170,000 | $200,000 |
| 2014 | $3,704 | $323,000 | $140,000 | $183,000 |
Source: Public Records
Map
Nearby Homes
- 21056 Country Park Rd
- 20251 Franciscan Way
- 17671 Riverbend Rd
- 27606 Prestancia Cir
- 17716 Riverbend Rd
- 14104 Reservation Rd
- 14004 Reservation Rd
- 27812 Crowne Point Dr
- 22276 Veronica Dr
- 20 Hitchcock Rd
- 19379 Acclaim Dr
- 22300 Capote Dr
- 21775 Woodrose Place
- 23020 Guidotti Dr
- 18114 Stonehaven
- 435 Shelley Way
- 1310 Primavera St Unit 118
- 1223 La Canada Way
- 307 De la Vina Way
- 148 Del Mar Dr
- 19206 Creekside Ln Unit 100
- 19210 Creekside Ln
- 19204 Creekside Ln Unit 101
- 19202 Creekside Ln
- 19212 Creekside Ln
- 19214 Creekside Ln
- 19200 Creekside Ln
- 19216 Creekside Ln
- 19218 Creekside Ln
- 19220 Creekside Ln Unit 93
- 19222 Creekside Ln Unit 92
- 19302 Creekside Cir
- 19306 Creekside Cir Unit 49
- 19110 Creekside Place
- 19304 Creekside Cir Unit 50
- 19300 Creekside Cir
- 19112 Creekside Place Unit 58
- 19310 Creekside Cir
- 19114 Creekside Place
- 19108 Creekside Place