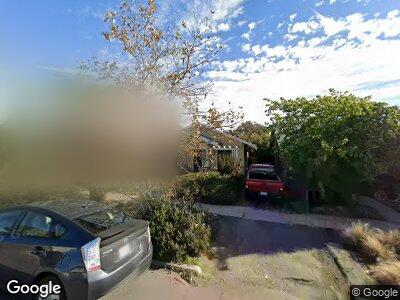
1921 32nd St San Diego, CA 92102
South Park NeighborhoodEstimated Value: $1,126,728 - $1,459,000
2
Beds
1
Bath
1,500
Sq Ft
$865/Sq Ft
Est. Value
About This Home
This home is located at 1921 32nd St, San Diego, CA 92102 and is currently estimated at $1,297,182, approximately $864 per square foot. 1921 32nd St is a home located in San Diego County with nearby schools including Golden Hill Elementary School, Roosevelt International Middle School, and Mcgill School Of Success.
Ownership History
Date
Name
Owned For
Owner Type
Purchase Details
Closed on
Nov 2, 2023
Sold by
Hempton Alexander Fairland
Bought by
Hempton Sullivan Trust and Hempton
Current Estimated Value
Purchase Details
Closed on
Sep 5, 2008
Sold by
Crippen Earl John
Bought by
Hempton Alexander Fairland
Home Financials for this Owner
Home Financials are based on the most recent Mortgage that was taken out on this home.
Original Mortgage
$324,000
Interest Rate
6.49%
Mortgage Type
Purchase Money Mortgage
Purchase Details
Closed on
Jan 5, 2006
Sold by
Crippen Earl I J
Bought by
Crippen Earl I J and Crippen Earl John
Home Financials for this Owner
Home Financials are based on the most recent Mortgage that was taken out on this home.
Original Mortgage
$100,000
Interest Rate
6.25%
Mortgage Type
Credit Line Revolving
Purchase Details
Closed on
Mar 14, 2003
Sold by
Crippen Earl I J and Crippen Louise N
Bought by
Crippen Earl Irvin Jake and Crippen Louise Natividad
Create a Home Valuation Report for This Property
The Home Valuation Report is an in-depth analysis detailing your home's value as well as a comparison with similar homes in the area
Home Values in the Area
Average Home Value in this Area
Purchase History
| Date | Buyer | Sale Price | Title Company |
|---|---|---|---|
| Hempton Sullivan Trust | -- | None Listed On Document | |
| Hempton Alexander Fairland | $360,000 | Southland Title Of San Diego | |
| Crippen Earl I J | -- | None Available | |
| Crippen Earl Irvin Jake | -- | -- |
Source: Public Records
Mortgage History
| Date | Status | Borrower | Loan Amount |
|---|---|---|---|
| Open | Hempton Sullivan Trust | $684,500 | |
| Previous Owner | Hempton Alexander Fairland | $314,500 | |
| Previous Owner | Hempton Alexander Fairland | $324,000 | |
| Previous Owner | Crippen Earl | $100,000 |
Source: Public Records
Tax History Compared to Growth
Tax History
| Year | Tax Paid | Tax Assessment Tax Assessment Total Assessment is a certain percentage of the fair market value that is determined by local assessors to be the total taxable value of land and additions on the property. | Land | Improvement |
|---|---|---|---|---|
| 2024 | $5,531 | $454,488 | $315,619 | $138,869 |
| 2023 | $5,407 | $445,578 | $309,431 | $136,147 |
| 2022 | $5,261 | $436,842 | $303,364 | $133,478 |
| 2021 | $5,224 | $428,277 | $297,416 | $130,861 |
| 2020 | $5,160 | $423,887 | $294,367 | $129,520 |
| 2019 | $5,066 | $415,577 | $288,596 | $126,981 |
| 2018 | $4,736 | $407,430 | $282,938 | $124,492 |
| 2017 | $4,622 | $399,442 | $277,391 | $122,051 |
| 2016 | $4,546 | $391,610 | $271,952 | $119,658 |
| 2015 | $4,478 | $385,729 | $267,868 | $117,861 |
| 2014 | $4,407 | $378,174 | $262,621 | $115,553 |
Source: Public Records
Map
Nearby Homes
- 1958 32nd St
- 1919 33rd St
- 1819-21 Felton St
- 2020-22 Gregory St
- 2211 Bancroft St
- 1916 Fern St
- 3195 Juniper St
- 2958 Grape St
- 1740 Petra Dr
- 1435 30th St
- 2513 30th St
- 2982 Laurel St
- 2939 Laurel St Unit 204
- 2810 Ivy St
- 1524 Bridgeview Dr
- 2967 B St Unit 6
- 1035 Edgemont Place
- 1484 Bridgeview Dr
- 3122 Olive St
- 3005 Olive St