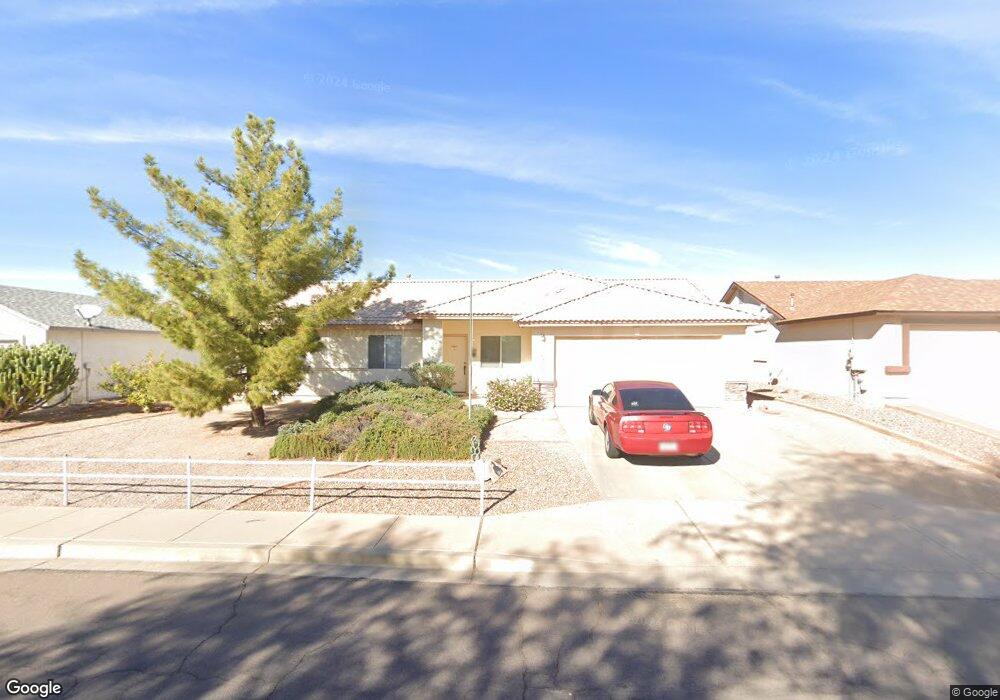
1926 W 11th Ave Apache Junction, AZ 85120
Estimated Value: $319,113 - $366,000
Studio
--
Bath
1,271
Sq Ft
$270/Sq Ft
Est. Value
About This Home
This home is located at 1926 W 11th Ave, Apache Junction, AZ 85120 and is currently estimated at $343,028, approximately $269 per square foot. 1926 W 11th Ave is a home located in Pinal County with nearby schools including Four Peaks Elementary School, Cactus Canyon Junior High School, and Apache Junction High School.
Ownership History
Date
Name
Owned For
Owner Type
Purchase Details
Closed on
Oct 9, 2018
Sold by
Goats Alan
Bought by
Goats Barbara Lucille
Current Estimated Value
Purchase Details
Closed on
Sep 15, 2006
Sold by
Robinson William L
Bought by
Robinson William L and Spears Brenda K
Purchase Details
Closed on
May 2, 1997
Sold by
Src Homes Inc
Bought by
Wisemon Eddie J
Home Financials for this Owner
Home Financials are based on the most recent Mortgage that was taken out on this home.
Original Mortgage
$95,548
Outstanding Balance
$10,109
Interest Rate
8.15%
Mortgage Type
VA
Estimated Equity
$332,919
Purchase Details
Closed on
Nov 7, 1996
Sold by
Ray Ellsworth S
Bought by
Src Homes Inc
Home Financials for this Owner
Home Financials are based on the most recent Mortgage that was taken out on this home.
Original Mortgage
$74,900
Interest Rate
7.59%
Create a Home Valuation Report for This Property
The Home Valuation Report is an in-depth analysis detailing your home's value as well as a comparison with similar homes in the area
Home Values in the Area
Average Home Value in this Area
Purchase History
| Date | Buyer | Sale Price | Title Company |
|---|---|---|---|
| Goats Barbara Lucille | -- | Security Title Agency Inc | |
| Robinson William L | -- | Guaranty Title Agency | |
| Wisemon Eddie J | $93,675 | Ati Title Agency | |
| Src Homes Inc | -- | Ati Title Agency |
Source: Public Records
Mortgage History
| Date | Status | Borrower | Loan Amount |
|---|---|---|---|
| Open | Wisemon Eddie J | $95,548 | |
| Previous Owner | Src Homes Inc | $74,900 |
Source: Public Records
Tax History
| Year | Tax Paid | Tax Assessment Tax Assessment Total Assessment is a certain percentage of the fair market value that is determined by local assessors to be the total taxable value of land and additions on the property. | Land | Improvement |
|---|---|---|---|---|
| 2025 | $1,221 | $28,302 | -- | -- |
| 2024 | $1,148 | $29,571 | -- | -- |
| 2023 | $1,200 | $22,494 | $3,094 | $19,400 |
| 2022 | $1,148 | $16,931 | $3,094 | $13,837 |
| 2021 | $1,183 | $16,066 | $0 | $0 |
| 2020 | $1,154 | $15,129 | $0 | $0 |
| 2019 | $1,105 | $14,610 | $0 | $0 |
| 2018 | $1,081 | $11,599 | $0 | $0 |
| 2017 | $1,054 | $11,057 | $0 | $0 |
| 2016 | $1,023 | $10,888 | $1,100 | $9,788 |
| 2014 | $981 | $6,353 | $1,100 | $5,253 |
Source: Public Records
Map
Nearby Homes
- 1881 W 12th Ave
- 1218 S Palo Verde Dr
- 1745 W 13th Ave
- 1694 W 13th Ave
- 1879 W 14th Ave
- 938 S Palo Verde Dr
- 1178 S Ocotillo Dr
- 1346 S Main Dr
- 1311 S Mara Dr
- 292 S Ocotillo Dr Unit 41
- 908 S Ocotillo Dr
- 1121 S Lawther Dr
- 948 S Lawther Dr
- 1511 S Grand Dr
- 1281 S Delaware Dr
- 2368 W 10th Ave
- 1432 S Lawther Dr
- 1468 S Lawther Dr
- 1427 S Delaware Dr
- 537 S Delaware Dr Unit 221
- 1898 W 11th Ave
- 1938 W 11th Ave
- 1925 W Ray Ln
- 1925 W Ray Ln
- 1895 W Ray Ln
- 1937 W Ray Ln
- 1882 W 11th Ave
- 0 S Palo Verde Dr Unit 6233940
- 1883 W Ray Ln
- 1874 W 11th Ave
- 1885 W 11th Ave
- 1108 S Palo Verde Dr
- 1126 S Palo Verde Dr
- 1875 W Ray Ln
- 1092 S Palo Verde Dr
- 1142 S Palo Verde Dr
- 1877 W 11th Ave
- 1074 S Palo Verde Dr
- 1852 W 11th Ave
- 1936 W Ray Ln
Your Personal Tour Guide
Ask me questions while you tour the home.