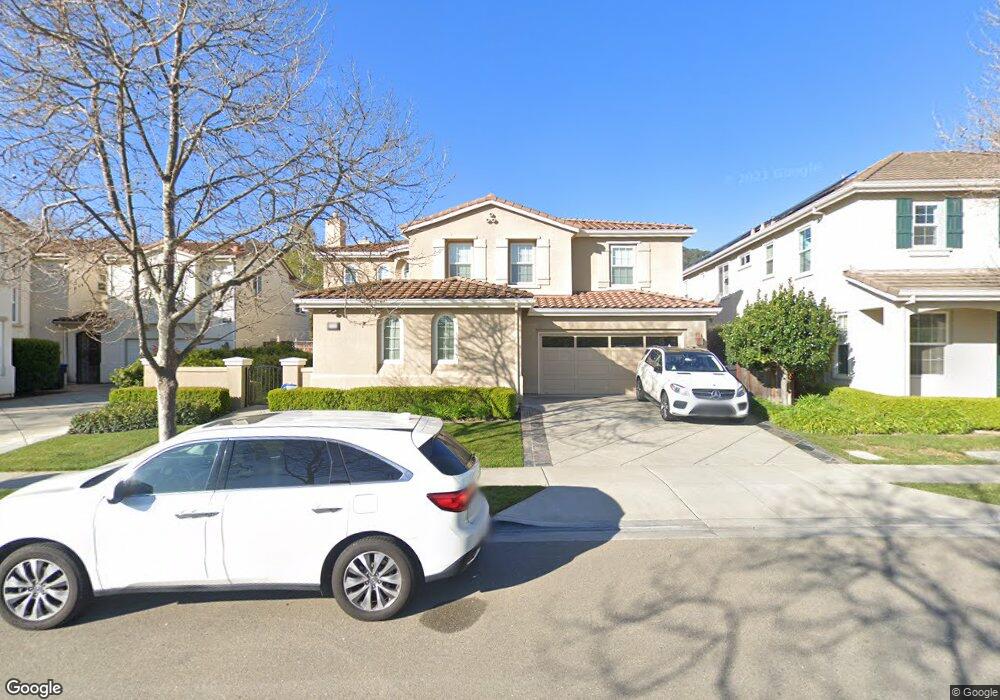
1926 W Lagoon Rd Pleasanton, CA 94566
Pheasant Ridge NeighborhoodEstimated Value: $2,145,000 - $2,767,000
5
Beds
4
Baths
3,722
Sq Ft
$672/Sq Ft
Est. Value
About This Home
This home is located at 1926 W Lagoon Rd, Pleasanton, CA 94566 and is currently estimated at $2,499,384, approximately $671 per square foot. 1926 W Lagoon Rd is a home located in Alameda County with nearby schools including Phoebe Apperson Hearst Elementary School, Pleasanton Middle School, and Foothill High School.
Ownership History
Date
Name
Owned For
Owner Type
Purchase Details
Closed on
Feb 7, 2024
Sold by
Lee Jaehwa and Kim Miyol
Bought by
Jaehwa Lee And Miyol Kim 2024 Revocable Trust and Lee
Current Estimated Value
Purchase Details
Closed on
May 8, 2019
Sold by
Steve Lee And Song Hui Park Family Trust
Bought by
Lee Jaehwa and Kim Miyol
Home Financials for this Owner
Home Financials are based on the most recent Mortgage that was taken out on this home.
Original Mortgage
$1,400,000
Interest Rate
4%
Mortgage Type
Adjustable Rate Mortgage/ARM
Purchase Details
Closed on
Jan 20, 2015
Sold by
Lee Steve Hyun and Park Song Hui
Bought by
The Steve Lee & Song Hui Park Family Tru
Purchase Details
Closed on
Oct 5, 2004
Sold by
Ghc Bernal Investors Llc
Bought by
Lee Steve Hyun and Park Song Hui
Home Financials for this Owner
Home Financials are based on the most recent Mortgage that was taken out on this home.
Original Mortgage
$921,000
Interest Rate
4.75%
Mortgage Type
Purchase Money Mortgage
Create a Home Valuation Report for This Property
The Home Valuation Report is an in-depth analysis detailing your home's value as well as a comparison with similar homes in the area
Home Values in the Area
Average Home Value in this Area
Purchase History
| Date | Buyer | Sale Price | Title Company |
|---|---|---|---|
| Jaehwa Lee And Miyol Kim 2024 Revocable Trust | -- | None Listed On Document | |
| Lee Jaehwa | $1,755,000 | First American Title Comapny | |
| The Steve Lee & Song Hui Park Family Tru | -- | None Available | |
| Lee Steve Hyun | -- | First American Title Co |
Source: Public Records
Mortgage History
| Date | Status | Borrower | Loan Amount |
|---|---|---|---|
| Previous Owner | Lee Jaehwa | $1,400,000 | |
| Previous Owner | Lee Steve Hyun | $921,000 |
Source: Public Records
Tax History Compared to Growth
Tax History
| Year | Tax Paid | Tax Assessment Tax Assessment Total Assessment is a certain percentage of the fair market value that is determined by local assessors to be the total taxable value of land and additions on the property. | Land | Improvement |
|---|---|---|---|---|
| 2025 | $22,535 | $1,957,701 | $587,310 | $1,370,391 |
| 2024 | $22,535 | $1,919,320 | $575,796 | $1,343,524 |
| 2023 | $22,279 | $1,881,693 | $564,508 | $1,317,185 |
| 2022 | $21,104 | $1,844,803 | $553,441 | $1,291,362 |
| 2021 | $20,564 | $1,808,631 | $542,589 | $1,266,042 |
| 2020 | $20,302 | $1,790,100 | $537,030 | $1,253,070 |
| 2019 | $17,907 | $1,535,110 | $460,558 | $1,074,552 |
| 2018 | $17,544 | $1,505,022 | $451,531 | $1,053,491 |
| 2017 | $17,093 | $1,475,523 | $442,681 | $1,032,842 |
| 2016 | $15,786 | $1,446,602 | $434,004 | $1,012,598 |
| 2015 | $15,490 | $1,424,880 | $427,487 | $997,393 |
| 2014 | $14,199 | $1,258,000 | $377,400 | $880,600 |
Source: Public Records
Map
Nearby Homes
- 2004 W Lagoon Rd
- 1612 Laguna Hills Ln
- 1360 Brookline Loop
- 2137 Arroyo Ct Unit 4
- 1380 Brookline Loop
- 2122 Arroyo Ct Unit 3
- 2207 Segundo Ct Unit 2
- 2178 Inverness Ct
- 11 Foothill Ln
- 2545 Corte Rivera
- 6686 Via San Blas
- 5363 Sonoma Dr
- 20 Fairway Ln
- 4655 Augustine St
- 68 Peters Ave Unit 6
- 5995 Via Del Cielo
- 466 Rose Ave
- 540 Hamilton Way
- 1550 Calle Enrique
- 5731 San Juan Way
- 1950 W Lagoon Rd
- 1908 W Lagoon Rd
- 7287 Royal Oaks Ct
- 1962 W Lagoon Rd
- 1890 W Lagoon Rd
- 7302 Royal Oaks Ct
- 1872 W Lagoon Rd
- 1976 W Lagoon Rd
- 7318 Shady Mill Ln
- 7302 Shady Mill Ln
- 7305 Royal Oaks Ct
- 1818 W Lagoon Rd
- 7320 Royal Oaks Ct
- 7338 Shady Mill Ln
- 7305 Shady Mill Ln
- 1984 W Lagoon Rd
- 1782 W Lagoon Rd
- 7323 Royal Oaks Ct
- 7195 Hickorywood Ln
- 7211 Rosecliff Ct