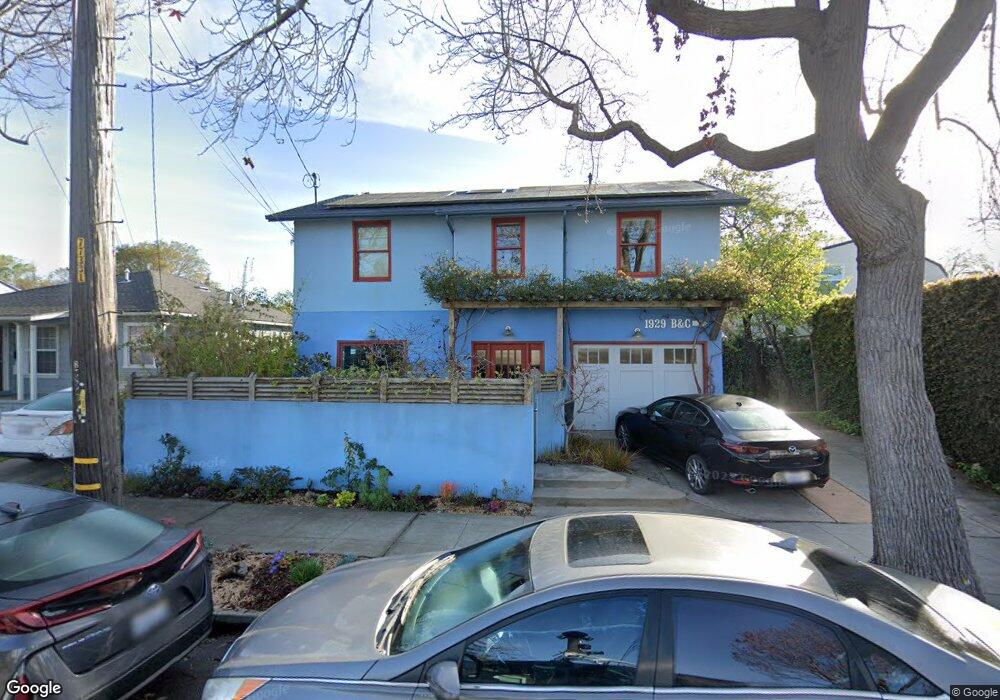
1929 8th St Unit C Berkeley, CA 94710
West Berkeley NeighborhoodEstimated Value: $922,000 - $1,410,000
3
Beds
3
Baths
1,989
Sq Ft
$585/Sq Ft
Est. Value
About This Home
This home is located at 1929 8th St Unit C, Berkeley, CA 94710 and is currently estimated at $1,164,553, approximately $585 per square foot. 1929 8th St Unit C is a home located in Alameda County with nearby schools including Rosa Parks Elementary School, Ruth Acty Elementary, and Berkeley Arts Magnet at Whittier School.
Ownership History
Date
Name
Owned For
Owner Type
Purchase Details
Closed on
May 4, 2021
Sold by
Flache Kai and Voth Anja
Bought by
Flache Kai and Voth Anja
Current Estimated Value
Home Financials for this Owner
Home Financials are based on the most recent Mortgage that was taken out on this home.
Original Mortgage
$322,803
Outstanding Balance
$243,470
Interest Rate
2.9%
Mortgage Type
New Conventional
Estimated Equity
$921,083
Purchase Details
Closed on
Feb 28, 2018
Sold by
Flache Kai
Bought by
Flache Kai and Voth Anja
Purchase Details
Closed on
Jul 26, 2006
Sold by
Flache Volker and Flache Ursula
Bought by
Flache Kai and Voth Anja
Home Financials for this Owner
Home Financials are based on the most recent Mortgage that was taken out on this home.
Original Mortgage
$417,000
Interest Rate
6.87%
Mortgage Type
Purchase Money Mortgage
Create a Home Valuation Report for This Property
The Home Valuation Report is an in-depth analysis detailing your home's value as well as a comparison with similar homes in the area
Home Values in the Area
Average Home Value in this Area
Purchase History
| Date | Buyer | Sale Price | Title Company |
|---|---|---|---|
| Flache Kai | -- | Accommodation | |
| Flache Kai | -- | Accommodation | |
| Flache Kai | -- | None Available | |
| Flache Kai | $208,500 | Placer Title Company |
Source: Public Records
Mortgage History
| Date | Status | Borrower | Loan Amount |
|---|---|---|---|
| Open | Flache Kai | $322,803 | |
| Previous Owner | Flache Kai | $417,000 |
Source: Public Records
Tax History
| Year | Tax Paid | Tax Assessment Tax Assessment Total Assessment is a certain percentage of the fair market value that is determined by local assessors to be the total taxable value of land and additions on the property. | Land | Improvement |
|---|---|---|---|---|
| 2025 | $11,907 | $720,454 | $177,516 | $549,938 |
| 2024 | $11,907 | $706,194 | $174,036 | $539,158 |
| 2023 | $11,650 | $699,212 | $170,624 | $528,588 |
| 2022 | $11,419 | $678,506 | $167,279 | $518,227 |
| 2021 | $11,433 | $665,067 | $164,000 | $508,067 |
| 2020 | $10,760 | $665,177 | $162,319 | $502,858 |
| 2019 | $10,273 | $652,139 | $159,137 | $493,002 |
| 2018 | $10,088 | $639,357 | $156,018 | $483,339 |
| 2017 | $9,738 | $626,824 | $152,960 | $473,864 |
| 2016 | $9,384 | $614,536 | $149,961 | $464,575 |
| 2015 | $9,252 | $605,310 | $147,710 | $457,600 |
| 2014 | $9,171 | $593,456 | $144,817 | $448,639 |
Source: Public Records
Map
Nearby Homes
- 2013 9th St
- 940 Delaware St
- 817 Delaware St
- 1050 Allston Way
- 1128 Delaware St
- 995 Virginia St
- 2220 7th St
- 2241 Ninth St
- 1919 Curtis St
- 2238 7th St
- 931 Bancroft Way
- 2144 Curtis St
- 1728 Curtis St
- 2231 Byron St
- 1261 Hearst Ave
- 2327 10th St Unit 4
- 1039 Channing Way
- 921 Jones St
- 1631 Belvedere Ave
- 817 Jones St
- 1929 8th St Unit B
- 1929 8th St Unit A
- 1923 8th St
- 951 University Ave
- 1917 8th St
- 933 University Ave
- 931 University Ave
- 1911 8th St Unit A
- 1911 8th St Unit B
- 1911 8th St Unit B
- 1922 8th St
- 1930 9th St
- 1918 8th St
- 1909 8th St
- 921 University Ave
- 1914 8th St
- 0 Eighth St
- 1910 8th St
- 928 Hearst Ave
- 1924 Eighth St
Your Personal Tour Guide
Ask me questions while you tour the home.