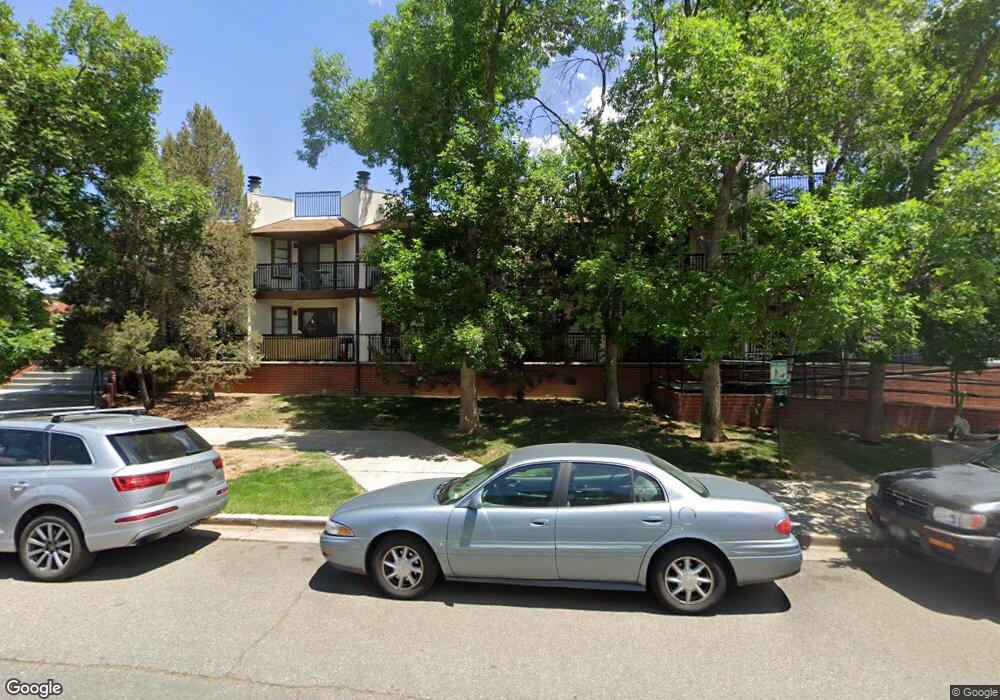
1934 18th St Unit 18 Boulder, CO 80302
Downtown NeighborhoodEstimated Value: $314,000 - $338,000
1
Bed
1
Bath
406
Sq Ft
$807/Sq Ft
Est. Value
About This Home
This home is located at 1934 18th St Unit 18, Boulder, CO 80302 and is currently estimated at $327,678, approximately $807 per square foot. 1934 18th St Unit 18 is a home located in Boulder County with nearby schools including Whittier Elementary School, Casey Middle School, and Boulder High School.
Ownership History
Date
Name
Owned For
Owner Type
Purchase Details
Closed on
Dec 23, 2002
Sold by
Tyler Denise Y
Bought by
Tyler Denise Yvonne
Current Estimated Value
Home Financials for this Owner
Home Financials are based on the most recent Mortgage that was taken out on this home.
Original Mortgage
$72,500
Outstanding Balance
$28,353
Interest Rate
5%
Mortgage Type
Purchase Money Mortgage
Estimated Equity
$299,325
Purchase Details
Closed on
Aug 27, 1997
Sold by
Hoeffler John R Trust
Bought by
Tyler Denise Y
Home Financials for this Owner
Home Financials are based on the most recent Mortgage that was taken out on this home.
Original Mortgage
$71,450
Interest Rate
7.46%
Mortgage Type
FHA
Purchase Details
Closed on
May 2, 1989
Bought by
Tyler Denise Yvonne
Purchase Details
Closed on
Jan 6, 1989
Bought by
Tyler Denise Yvonne
Create a Home Valuation Report for This Property
The Home Valuation Report is an in-depth analysis detailing your home's value as well as a comparison with similar homes in the area
Home Values in the Area
Average Home Value in this Area
Purchase History
| Date | Buyer | Sale Price | Title Company |
|---|---|---|---|
| Tyler Denise Yvonne | -- | -- | |
| Tyler Denise Y | $73,900 | First American Heritage Titl | |
| Tyler Denise Yvonne | $27,000 | -- | |
| Tyler Denise Yvonne | -- | -- |
Source: Public Records
Mortgage History
| Date | Status | Borrower | Loan Amount |
|---|---|---|---|
| Open | Tyler Denise Yvonne | $72,500 | |
| Closed | Tyler Denise Y | $71,450 |
Source: Public Records
Tax History
| Year | Tax Paid | Tax Assessment Tax Assessment Total Assessment is a certain percentage of the fair market value that is determined by local assessors to be the total taxable value of land and additions on the property. | Land | Improvement |
|---|---|---|---|---|
| 2025 | $1,764 | $21,931 | -- | $21,931 |
| 2024 | $1,764 | $21,931 | -- | $21,931 |
| 2023 | $1,734 | $20,077 | -- | $23,762 |
| 2022 | $1,795 | $19,328 | $0 | $19,328 |
| 2021 | $1,712 | $19,884 | $0 | $19,884 |
| 2020 | $1,485 | $17,060 | $0 | $17,060 |
| 2019 | $1,462 | $17,060 | $0 | $17,060 |
| 2018 | $1,298 | $14,969 | $0 | $14,969 |
| 2017 | $1,257 | $16,549 | $0 | $16,549 |
| 2016 | $1,215 | $14,033 | $0 | $14,033 |
| 2015 | $1,150 | $11,558 | $0 | $11,558 |
| 2014 | $994 | $11,558 | $0 | $11,558 |
Source: Public Records
Map
Nearby Homes
- 1837 Walnut St Unit E
- 1843 Walnut St Unit B
- 1707 Walnut St Unit 203
- 1707 Walnut St Unit 307
- 1707 Walnut St Unit 208
- 1707 Walnut St Unit 308
- 1707 Walnut St Unit 209
- 1707 Walnut St Unit 101
- 1707 Walnut St Unit 103
- 1707 Walnut St Unit 207
- 1707 Walnut St Unit 206
- 1707 Walnut St Unit 202
- 1938 Spruce St
- 1842 Canyon Blvd Unit 105
- 1842 Canyon Blvd Unit 202
- 1945 Canyon Blvd
- 1709 Pine St Unit 3
- 1629 17th St Unit A
- 1627 17th St
- 1605 17th St
- 1934 18th St Unit 27
- 1934 18th St Unit 26
- 1934 18th St Unit 25
- 1934 18th St Unit 24
- 1934 18th St Unit 23
- 1934 18th St Unit 22
- 1934 18th St Unit 21
- 1934 18th St Unit 20
- 1934 18th St Unit 19
- 1934 18th St Unit 17
- 1934 18th St Unit 16
- 1934 18th St Unit 15
- 1934 18th St Unit 13
- 1934 18th St Unit 12
- 1934 18th St Unit 10
- 1934 18th St Unit 9
- 1934 18th St Unit 8
- 1934 18th St Unit 7
- 1934 18th St Unit 6
- 1934 18th St Unit 5
Your Personal Tour Guide
Ask me questions while you tour the home.