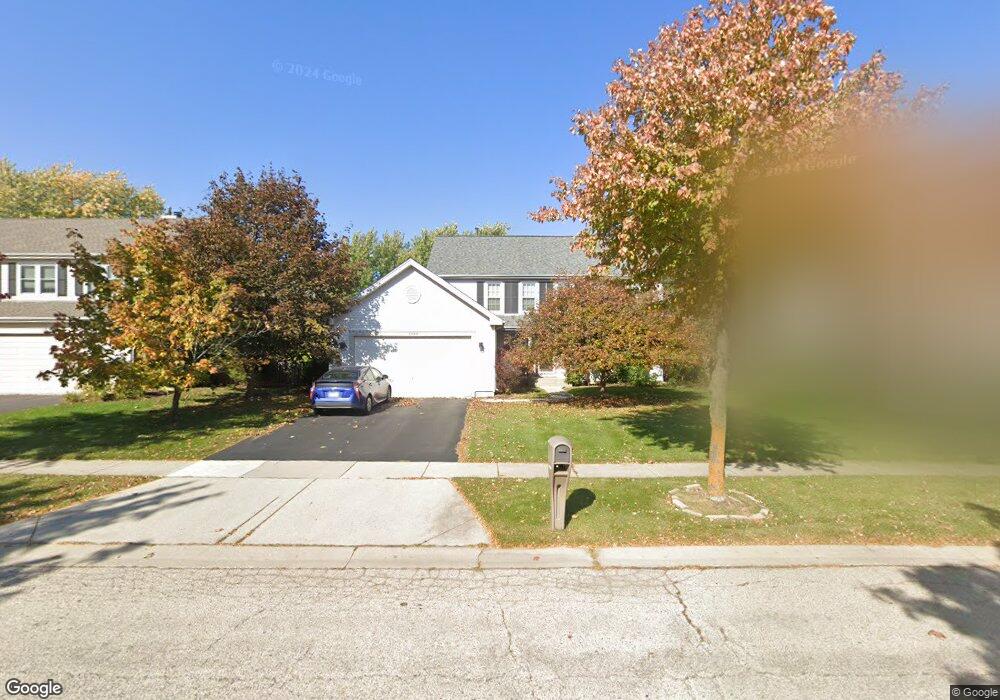
1940 Waverly Ln Algonquin, IL 60102
Estimated Value: $457,000 - $474,000
4
Beds
3
Baths
2,508
Sq Ft
$186/Sq Ft
Est. Value
About This Home
This home is located at 1940 Waverly Ln, Algonquin, IL 60102 and is currently estimated at $467,143, approximately $186 per square foot. 1940 Waverly Ln is a home located in Kane County with nearby schools including Westfield Community School, Harry D Jacobs High School, and St Margaret Mary Catholic School.
Ownership History
Date
Name
Owned For
Owner Type
Purchase Details
Closed on
Sep 29, 2008
Sold by
Simmons Paul K and Simmons Laura L
Bought by
Suzuki Hideo and Suzuki Sakiko
Current Estimated Value
Home Financials for this Owner
Home Financials are based on the most recent Mortgage that was taken out on this home.
Original Mortgage
$255,352
Outstanding Balance
$170,535
Interest Rate
6.52%
Mortgage Type
FHA
Estimated Equity
$296,608
Purchase Details
Closed on
Sep 27, 2002
Sold by
Dedic Leonard and Dedic Dawn M
Bought by
Simmons Paul K and Simmons Laura L
Home Financials for this Owner
Home Financials are based on the most recent Mortgage that was taken out on this home.
Original Mortgage
$269,300
Interest Rate
6.24%
Purchase Details
Closed on
Nov 30, 1994
Sold by
Willoughby Farms First Ltd Partnership
Bought by
Dedic Leonard and Dedic Dawn M
Home Financials for this Owner
Home Financials are based on the most recent Mortgage that was taken out on this home.
Original Mortgage
$148,000
Interest Rate
9.06%
Create a Home Valuation Report for This Property
The Home Valuation Report is an in-depth analysis detailing your home's value as well as a comparison with similar homes in the area
Home Values in the Area
Average Home Value in this Area
Purchase History
| Date | Buyer | Sale Price | Title Company |
|---|---|---|---|
| Suzuki Hideo | $260,000 | Security Title | |
| Simmons Paul K | $283,500 | -- | |
| Dedic Leonard | $191,500 | Chicago Title Insurance Co |
Source: Public Records
Mortgage History
| Date | Status | Borrower | Loan Amount |
|---|---|---|---|
| Open | Suzuki Hideo | $255,352 | |
| Previous Owner | Simmons Paul K | $269,300 | |
| Previous Owner | Dedic Leonard | $148,000 |
Source: Public Records
Tax History Compared to Growth
Tax History
| Year | Tax Paid | Tax Assessment Tax Assessment Total Assessment is a certain percentage of the fair market value that is determined by local assessors to be the total taxable value of land and additions on the property. | Land | Improvement |
|---|---|---|---|---|
| 2024 | $9,697 | $135,547 | $25,730 | $109,817 |
| 2023 | $9,275 | $121,961 | $23,151 | $98,810 |
| 2022 | $8,530 | $108,069 | $23,151 | $84,918 |
| 2021 | $8,281 | $102,038 | $21,859 | $80,179 |
| 2020 | $8,121 | $99,744 | $21,368 | $78,376 |
| 2019 | $7,875 | $94,688 | $20,285 | $74,403 |
| 2018 | $8,004 | $92,813 | $19,883 | $72,930 |
| 2017 | $7,684 | $86,823 | $18,600 | $68,223 |
| 2016 | $7,403 | $79,316 | $18,009 | $61,307 |
| 2015 | -- | $72,310 | $17,040 | $55,270 |
| 2014 | -- | $67,224 | $16,569 | $50,655 |
| 2013 | -- | $69,282 | $17,076 | $52,206 |
Source: Public Records
Map
Nearby Homes
- 1900 Waverly Ln
- 30 Arbordale Ct Unit 4284
- 2101 Peach Tree Ln Unit 4094
- 1971 Peach Tree Ln
- 2043 Peach Tree Ln Unit 4122
- 000 County Line Rd
- Marianne Plan at Algonquin Meadows - Traditional Townhomes
- Darcy Plan at Algonquin Meadows - Traditional Townhomes
- Charlotte Plan at Algonquin Meadows - Traditional Townhomes
- Adams Plan at Algonquin Meadows - Single Family
- Sequoia Plan at Algonquin Meadows - Single Family
- Bryce Plan at Algonquin Meadows - Single Family
- Rainier Plan at Algonquin Meadows - Single Family
- Santa Rosa Plan at Algonquin Meadows - Single Family
- Biscayne Plan at Algonquin Meadows - Single Family
- 2161 Burnham Ct
- 12 White Oak Ct
- 2060 Dorchester Ave
- Amherst Plan at Algonquin Meadows - Urban Townhomes
- Chatham Plan at Algonquin Meadows - Urban Townhomes
- 1930 Waverly Ln
- 1950 Waverly Ln Unit 8
- 1851 Arbordale Ln
- 1861 Arbordale Ln Unit 7
- 1841 Arbordale Ln
- 1920 Waverly Ln
- 1871 Arbordale Ln
- 1951 Waverly Ln
- 1961 Waverly Ln
- 1831 Arbordale Ln
- 1941 Waverly Ln
- 2006 Waverly Ln Unit 4291
- 1910 Waverly Ln
- 2000 Waverly Ln Unit 4294
- 2000 Waverly Ln Unit 2036
- 2004 Waverly Ln Unit 4292
- 2002 Waverly Ln Unit 4293
- 2004 Waverly Ln Unit 2004
- 2002 Waverly Ln Unit A
- 1931 Waverly Ln