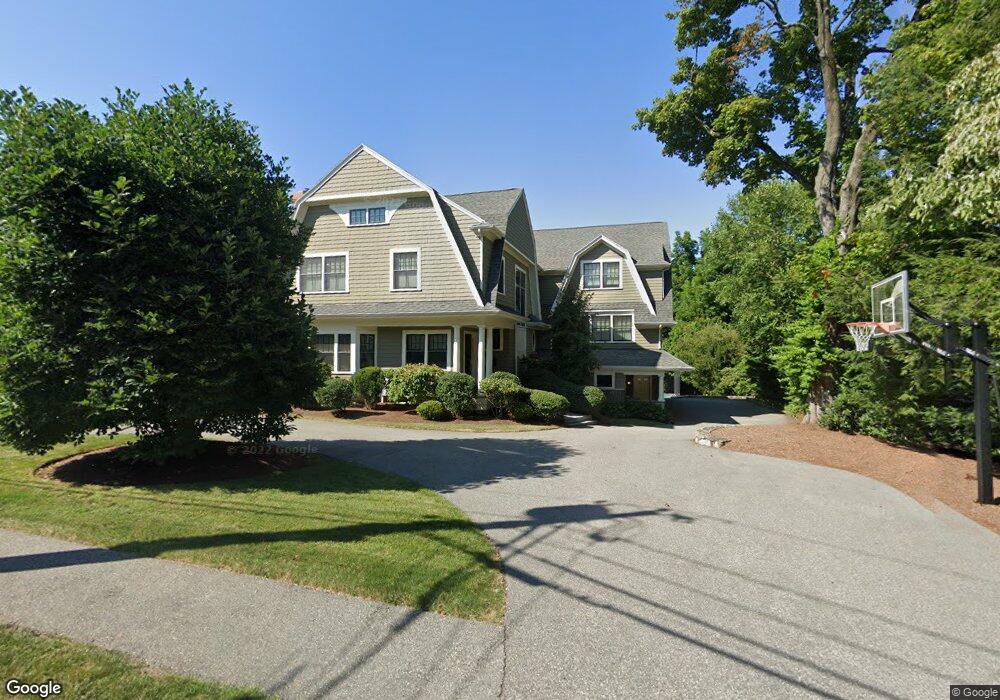
195 Windsor Rd Waban, MA 02468
Waban NeighborhoodEstimated Value: $4,957,784 - $8,321,000
6
Beds
8
Baths
7,000
Sq Ft
$892/Sq Ft
Est. Value
About This Home
This home is located at 195 Windsor Rd, Waban, MA 02468 and is currently estimated at $6,241,446, approximately $891 per square foot. 195 Windsor Rd is a home located in Middlesex County with nearby schools including Angier Elementary School, Charles E Brown Middle School, and Newton South High School.
Ownership History
Date
Name
Owned For
Owner Type
Purchase Details
Closed on
Oct 5, 2018
Sold by
195 Windsor Road Nt
Bought by
Kelly William J
Current Estimated Value
Home Financials for this Owner
Home Financials are based on the most recent Mortgage that was taken out on this home.
Original Mortgage
$461,000
Outstanding Balance
$395,322
Interest Rate
3.75%
Mortgage Type
Adjustable Rate Mortgage/ARM
Estimated Equity
$5,846,124
Create a Home Valuation Report for This Property
The Home Valuation Report is an in-depth analysis detailing your home's value as well as a comparison with similar homes in the area
Home Values in the Area
Average Home Value in this Area
Purchase History
| Date | Buyer | Sale Price | Title Company |
|---|---|---|---|
| Kelly William J | -- | -- |
Source: Public Records
Mortgage History
| Date | Status | Borrower | Loan Amount |
|---|---|---|---|
| Open | Kelly William J | $461,000 |
Source: Public Records
Tax History
| Year | Tax Paid | Tax Assessment Tax Assessment Total Assessment is a certain percentage of the fair market value that is determined by local assessors to be the total taxable value of land and additions on the property. | Land | Improvement |
|---|---|---|---|---|
| 2025 | $55,261 | $5,638,900 | $1,622,100 | $4,016,800 |
| 2024 | $53,433 | $5,474,700 | $1,574,900 | $3,899,800 |
| 2023 | $51,891 | $5,097,300 | $1,238,100 | $3,859,200 |
| 2022 | $49,651 | $4,719,700 | $1,146,400 | $3,573,300 |
| 2021 | $47,909 | $4,452,500 | $1,081,500 | $3,371,000 |
| 2020 | $46,484 | $4,452,500 | $1,081,500 | $3,371,000 |
| 2019 | $45,173 | $4,322,800 | $1,050,000 | $3,272,800 |
| 2018 | $44,277 | $4,092,100 | $948,400 | $3,143,700 |
| 2017 | $42,929 | $3,860,500 | $894,700 | $2,965,800 |
| 2016 | $41,058 | $3,607,900 | $836,200 | $2,771,700 |
| 2015 | $39,148 | $3,371,900 | $781,500 | $2,590,400 |
Source: Public Records
Map
Nearby Homes
- 115 Windsor Rd
- 29 Montclair Rd
- 20 Kinmonth Rd Unit 203
- 20 Kinmonth Rd Unit 306
- 20 Kinmonth Rd Unit 4
- 0 Metacomet Rd
- 33 Metacomet Rd
- 110 Avalon Rd
- 19 Gordon Rd
- 138 Waban Ave
- 34 Larchmont Ave
- 31 Wilde Rd
- 1754 Washington St
- 55 Evelyn Rd
- 155 Paulson Rd
- 64 Varick Rd
- 40 Sewall St
- 27 Tennyson Rd
- 177 Varick Rd
- 1230 Commonwealth Ave
Your Personal Tour Guide
Ask me questions while you tour the home.