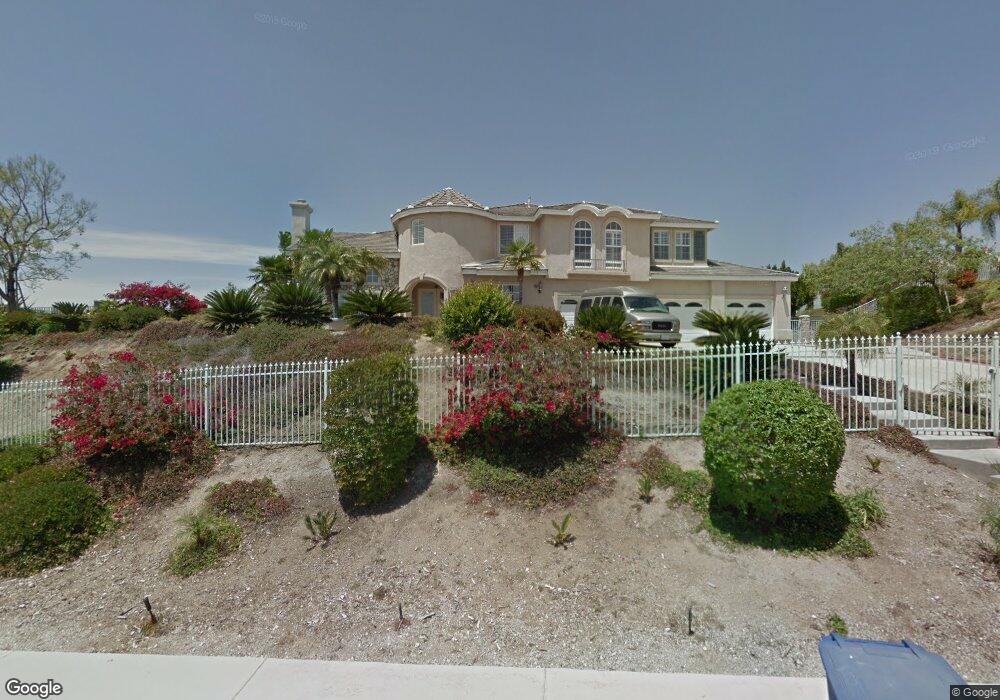
1951 Apostle Ln Riverside, CA 92506
Estimated Value: $1,490,000 - $1,956,000
6
Beds
5
Baths
5,679
Sq Ft
$304/Sq Ft
Est. Value
About This Home
This home is located at 1951 Apostle Ln, Riverside, CA 92506 and is currently estimated at $1,726,191, approximately $303 per square foot. 1951 Apostle Ln is a home located in Riverside County with nearby schools including Castle View Elementary School, Matthew Gage Middle School, and Polytechnic High School.
Ownership History
Date
Name
Owned For
Owner Type
Purchase Details
Closed on
Jul 31, 2015
Sold by
Tan Antonio A and Tan Rhoda J
Bought by
Family Trust Of Antonio A Tan & Rhoda J
Current Estimated Value
Purchase Details
Closed on
Jun 21, 2000
Sold by
Amberhill Falcon Crest Llc
Bought by
Tan Antonio A and Tan Rhoda J
Home Financials for this Owner
Home Financials are based on the most recent Mortgage that was taken out on this home.
Original Mortgage
$427,250
Outstanding Balance
$142,881
Interest Rate
7.5%
Mortgage Type
Purchase Money Mortgage
Estimated Equity
$1,583,310
Purchase Details
Closed on
Jan 11, 2000
Sold by
Amberhill Falcon Crest Llc
Bought by
Lewis John W and Lewis Diane M
Home Financials for this Owner
Home Financials are based on the most recent Mortgage that was taken out on this home.
Original Mortgage
$350,000
Interest Rate
8.25%
Mortgage Type
Purchase Money Mortgage
Create a Home Valuation Report for This Property
The Home Valuation Report is an in-depth analysis detailing your home's value as well as a comparison with similar homes in the area
Home Values in the Area
Average Home Value in this Area
Purchase History
| Date | Buyer | Sale Price | Title Company |
|---|---|---|---|
| Family Trust Of Antonio A Tan & Rhoda J | -- | None Available | |
| Tan Antonio A | $534,500 | Chicago Title | |
| Lewis John W | $510,000 | Chicago Title |
Source: Public Records
Mortgage History
| Date | Status | Borrower | Loan Amount |
|---|---|---|---|
| Open | Tan Antonio A | $427,250 | |
| Previous Owner | Lewis John W | $350,000 | |
| Closed | Tan Antonio A | $53,400 |
Source: Public Records
Tax History Compared to Growth
Tax History
| Year | Tax Paid | Tax Assessment Tax Assessment Total Assessment is a certain percentage of the fair market value that is determined by local assessors to be the total taxable value of land and additions on the property. | Land | Improvement |
|---|---|---|---|---|
| 2025 | $11,745 | $1,095,534 | $307,382 | $788,152 |
| 2023 | $11,745 | $1,052,996 | $295,447 | $757,549 |
| 2022 | $11,474 | $1,032,350 | $289,654 | $742,696 |
| 2021 | $11,296 | $1,012,109 | $283,975 | $728,134 |
| 2020 | $11,210 | $1,001,732 | $281,064 | $720,668 |
| 2019 | $10,996 | $982,091 | $275,553 | $706,538 |
| 2018 | $10,778 | $962,835 | $270,151 | $692,684 |
| 2017 | $10,584 | $943,956 | $264,854 | $679,102 |
| 2016 | $9,896 | $925,448 | $259,661 | $665,787 |
| 2015 | $9,755 | $911,548 | $255,761 | $655,787 |
| 2014 | $9,664 | $893,694 | $250,752 | $642,942 |
Source: Public Records
Map
Nearby Homes
- 1963 Middle Creek Rd
- 6743 Canyon Hill Dr
- 6281 Acela Ct
- 2290 Decade Ct
- 0 Century Ave
- 6351 Garden Hills Way
- 2111 Whitestone Dr
- 28976 Alessandro Blvd
- 0 Hawarden Vista Project Unit LG21131129
- 2249 Trafalgar Ave
- 6863 Canyon Hill Dr
- 0 Via Vista Dr Unit IV25239083
- 6141 Bluffwood Dr
- 6966 Ranch View Rd
- 6944 Ranch View Rd
- 6282 Shaker Dr
- 0 Rolling Ridge Rd
- 1544 Bellefontaine Dr
- 2490 Piedmont Dr
- 1341 Nettleton Ct
- 1931 Apostle Ln
- 1971 Apostle Ln
- 1958 Apostle Ln
- 1921 Apostle Ln
- 1938 Apostle Ln
- 1978 Apostle Ln
- 1998 Apostle Ln
- 1908 Apostle Ln
- 1956 Natalie Ln
- 1911 Apostle Ln
- 1918 Natalie Ln
- 1996 Natalie Ln
- 6555 Sunbeam Dr
- 1959 Natalie Ln
- 6561 Sunbeam Dr
- 6535 Sunbeam Dr
- 1939 Natalie Ln
- 1979 Natalie Ln
- 1911 Old Bridge Rd
- 2045 Old Bridge Rd