Estimated Value: $1,012,000 - $1,662,000
3
Beds
2
Baths
1,488
Sq Ft
$877/Sq Ft
Est. Value
About This Home
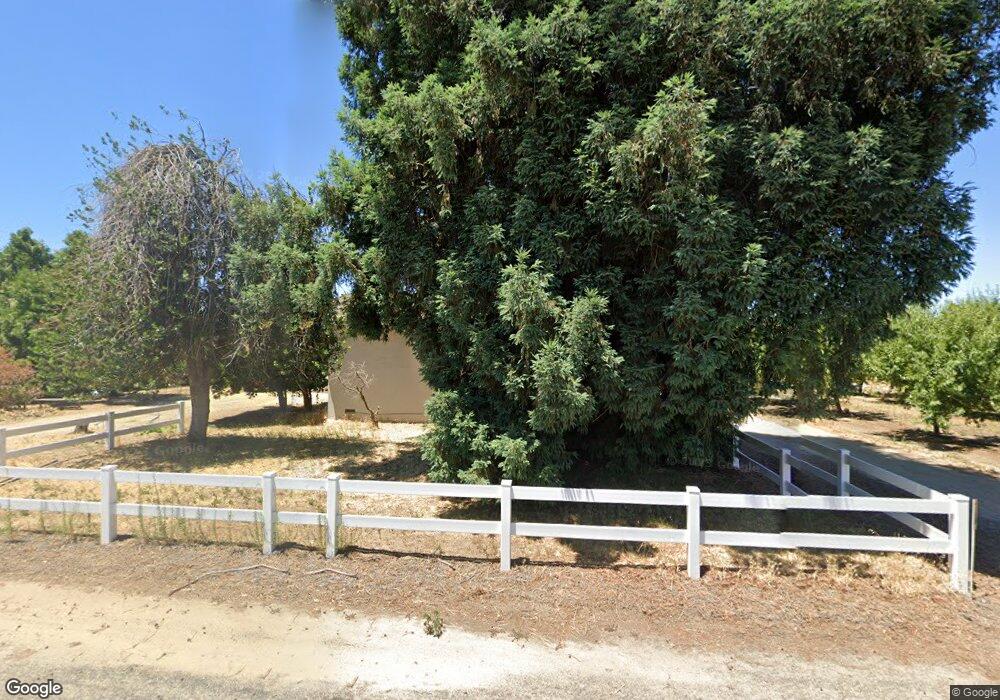
This home is located at 19515 N Ripon Rd Unit S, Ripon, CA 95366 and is currently estimated at $1,304,692, approximately $876 per square foot. 19515 N Ripon Rd Unit S is a home located in San Joaquin County with nearby schools including Park View Elementary School, Colony Oak Elementary School, and Ripona Elementary School.
Ownership History
Date
Name
Owned For
Owner Type
Purchase Details
Closed on
May 13, 2017
Sold by
Hsu Peili
Bought by
Hsu Peili
Current Estimated Value
Purchase Details
Closed on
Aug 25, 2015
Sold by
Hsu Tsannrong and Liu Hsiu Chu Hsu
Bought by
Hsu Peili
Purchase Details
Closed on
May 19, 1998
Sold by
Black Carolyn Ann
Bought by
Hsu Tsannrong and Hsu Hsiu Chu Liu
Purchase Details
Closed on
Jan 27, 1998
Sold by
Black Carolyn Ann
Bought by
Black Carolyn Ann
Purchase Details
Closed on
Nov 6, 1997
Sold by
Ehrig Anna Trust and Genevieve
Bought by
Black Carolyn Ann
Purchase Details
Closed on
Sep 28, 1994
Sold by
Ehrig Anna
Bought by
Ehrig Anna
Purchase Details
Closed on
Jan 26, 1987
Sold by
Ehrig Anna
Bought by
Ehrig Anna
Create a Home Valuation Report for This Property
The Home Valuation Report is an in-depth analysis detailing your home's value as well as a comparison with similar homes in the area
Purchase History
| Date | Buyer | Sale Price | Title Company |
|---|---|---|---|
| Hsu Peili | -- | None Available | |
| Hsu Peili | -- | None Available | |
| Hsu Peili | -- | None Available | |
| Hsu Tsannrong | -- | None Available | |
| Hsu Tsannrong | $360,000 | Chicago Title Co | |
| Black Carolyn Ann | -- | -- | |
| Black Carolyn Ann | -- | -- | |
| Ehrig Anna | -- | -- | |
| Ehrig Anna | -- | -- |
Source: Public Records
Tax History
| Year | Tax Paid | Tax Assessment Tax Assessment Total Assessment is a certain percentage of the fair market value that is determined by local assessors to be the total taxable value of land and additions on the property. | Land | Improvement |
|---|---|---|---|---|
| 2025 | $8,887 | $607,736 | $361,646 | $246,090 |
| 2024 | $8,495 | $597,892 | $354,555 | $243,337 |
| 2023 | $6,727 | $482,569 | $347,603 | $134,966 |
| 2022 | $6,113 | $473,108 | $340,788 | $132,320 |
| 2021 | $6,034 | $463,832 | $334,106 | $129,726 |
| 2020 | $5,814 | $442,872 | $314,476 | $128,396 |
| 2019 | $5,179 | $382,535 | $296,656 | $85,879 |
| 2018 | $6,326 | $488,122 | $317,841 | $170,281 |
| 2017 | $6,220 | $478,553 | $223,747 | $254,806 |
| 2016 | $6,131 | $469,172 | $204,505 | $264,667 |
| 2015 | $5,150 | $462,124 | $178,018 | $284,106 |
| 2014 | $2,647 | $233,710 | $155,560 | $78,150 |
Source: Public Records
Map
Nearby Homes
- 1842 Flagstone Dr
- 1725 N Ripon Rd
- 1681 Red Sky Way
- 1640 Carrara Ln
- 0 Murphy Rd Unit 225148414
- 18650 E Eugenia Ave
- 848 W Santos Ave
- 243 John Kamps Way
- 1537 Atlantic Ave
- 183 Haller Ct
- 621 Bouma Ln
- 15581 French Camp Rd
- 22022 99 Frontage Rd
- 565 Bodeson Ct
- 1178 Groen Ct
- 1181 Azalea St
- 14527 Louise Ave
- 960 Goodwin Dr
- 749 Nancy Dr
- 163 Franklin Ln
- 19655 N Ripon Rd
- 0 N Ripon Rd Unit ML80920965
- 19469 N Ripon Rd
- 19654 S North Ripon Rd
- 19733 N Ripon Rd Unit S
- 19377 N Ripon Rd
- 19317 N Ripon Rd
- 19814 N Ripon Rd
- 19818 N Ripon Rd Unit S
- 19959 N Ripon Rd Unit S
- 19982 N Ripon Rd Unit S
- 19642 N Ripon Rd Unit S
- 19270 N Ripon Rd
- 20060 N Ripon Rd
- 19009 N Ripon Rd Unit S
- 20152 N Ripon Rd
- 20150 N Ripon Rd Unit S
- 20020 N Ripon Rd
- 14430 E Donahue Ave
- 18888 N Ripon Rd Unit S
Your Personal Tour Guide
Ask me questions while you tour the home.